⚠️ This report was primarily generated by an AI model.⚠️
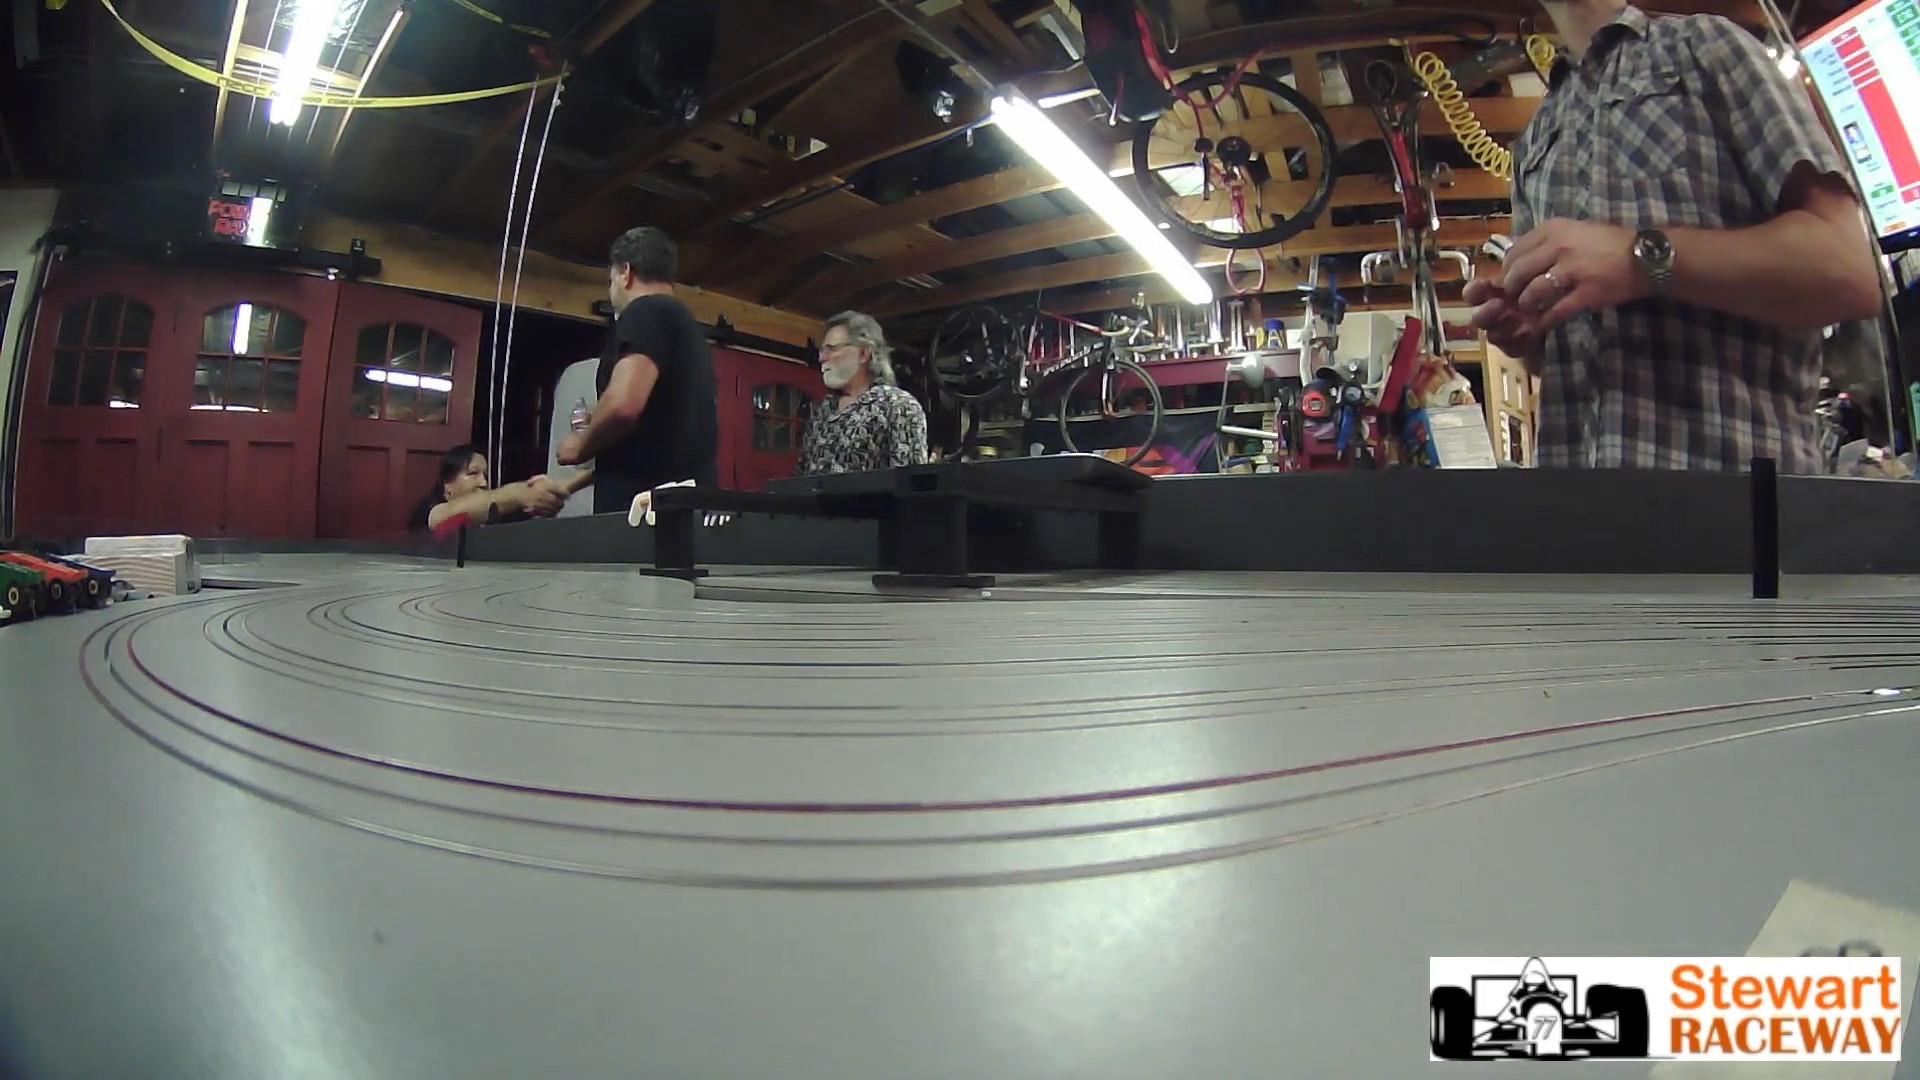
Jul-30-2026 – The racing world was on the edge of its collective seat last Thursday night as Stewart Raceway once again delivered a high-octane spectacle in Round 4 of its “Under The Lights” series. The evening was packed with breathtaking speed, strategic prowess, and a dramatic turn of events, including a controversial crash involving Team Jolly Rogers’ John Rogers in segment 5 of Race 4, that left a lasting impact on the night’s standings. The debut of the new MG+ Modified class on Stewart Raceway II (SR2) added an extra layer of excitement, showcasing the cutting edge of slot car performance.
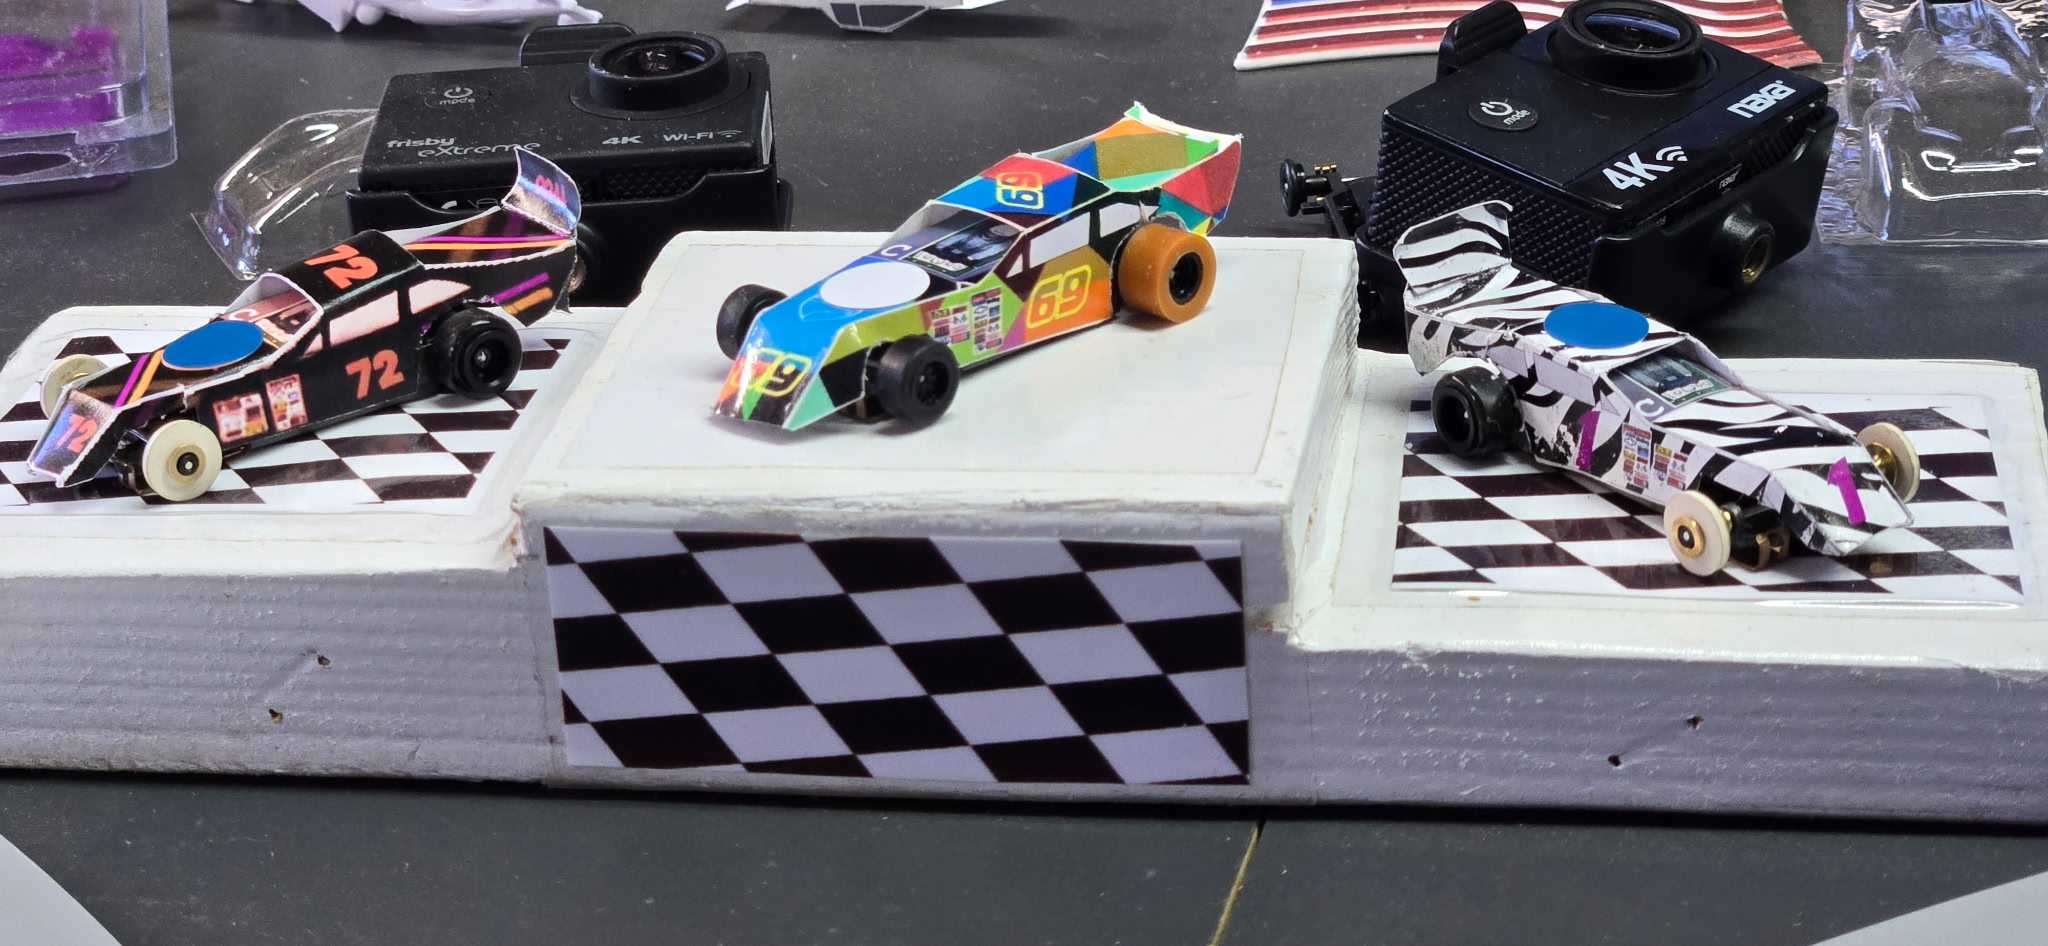
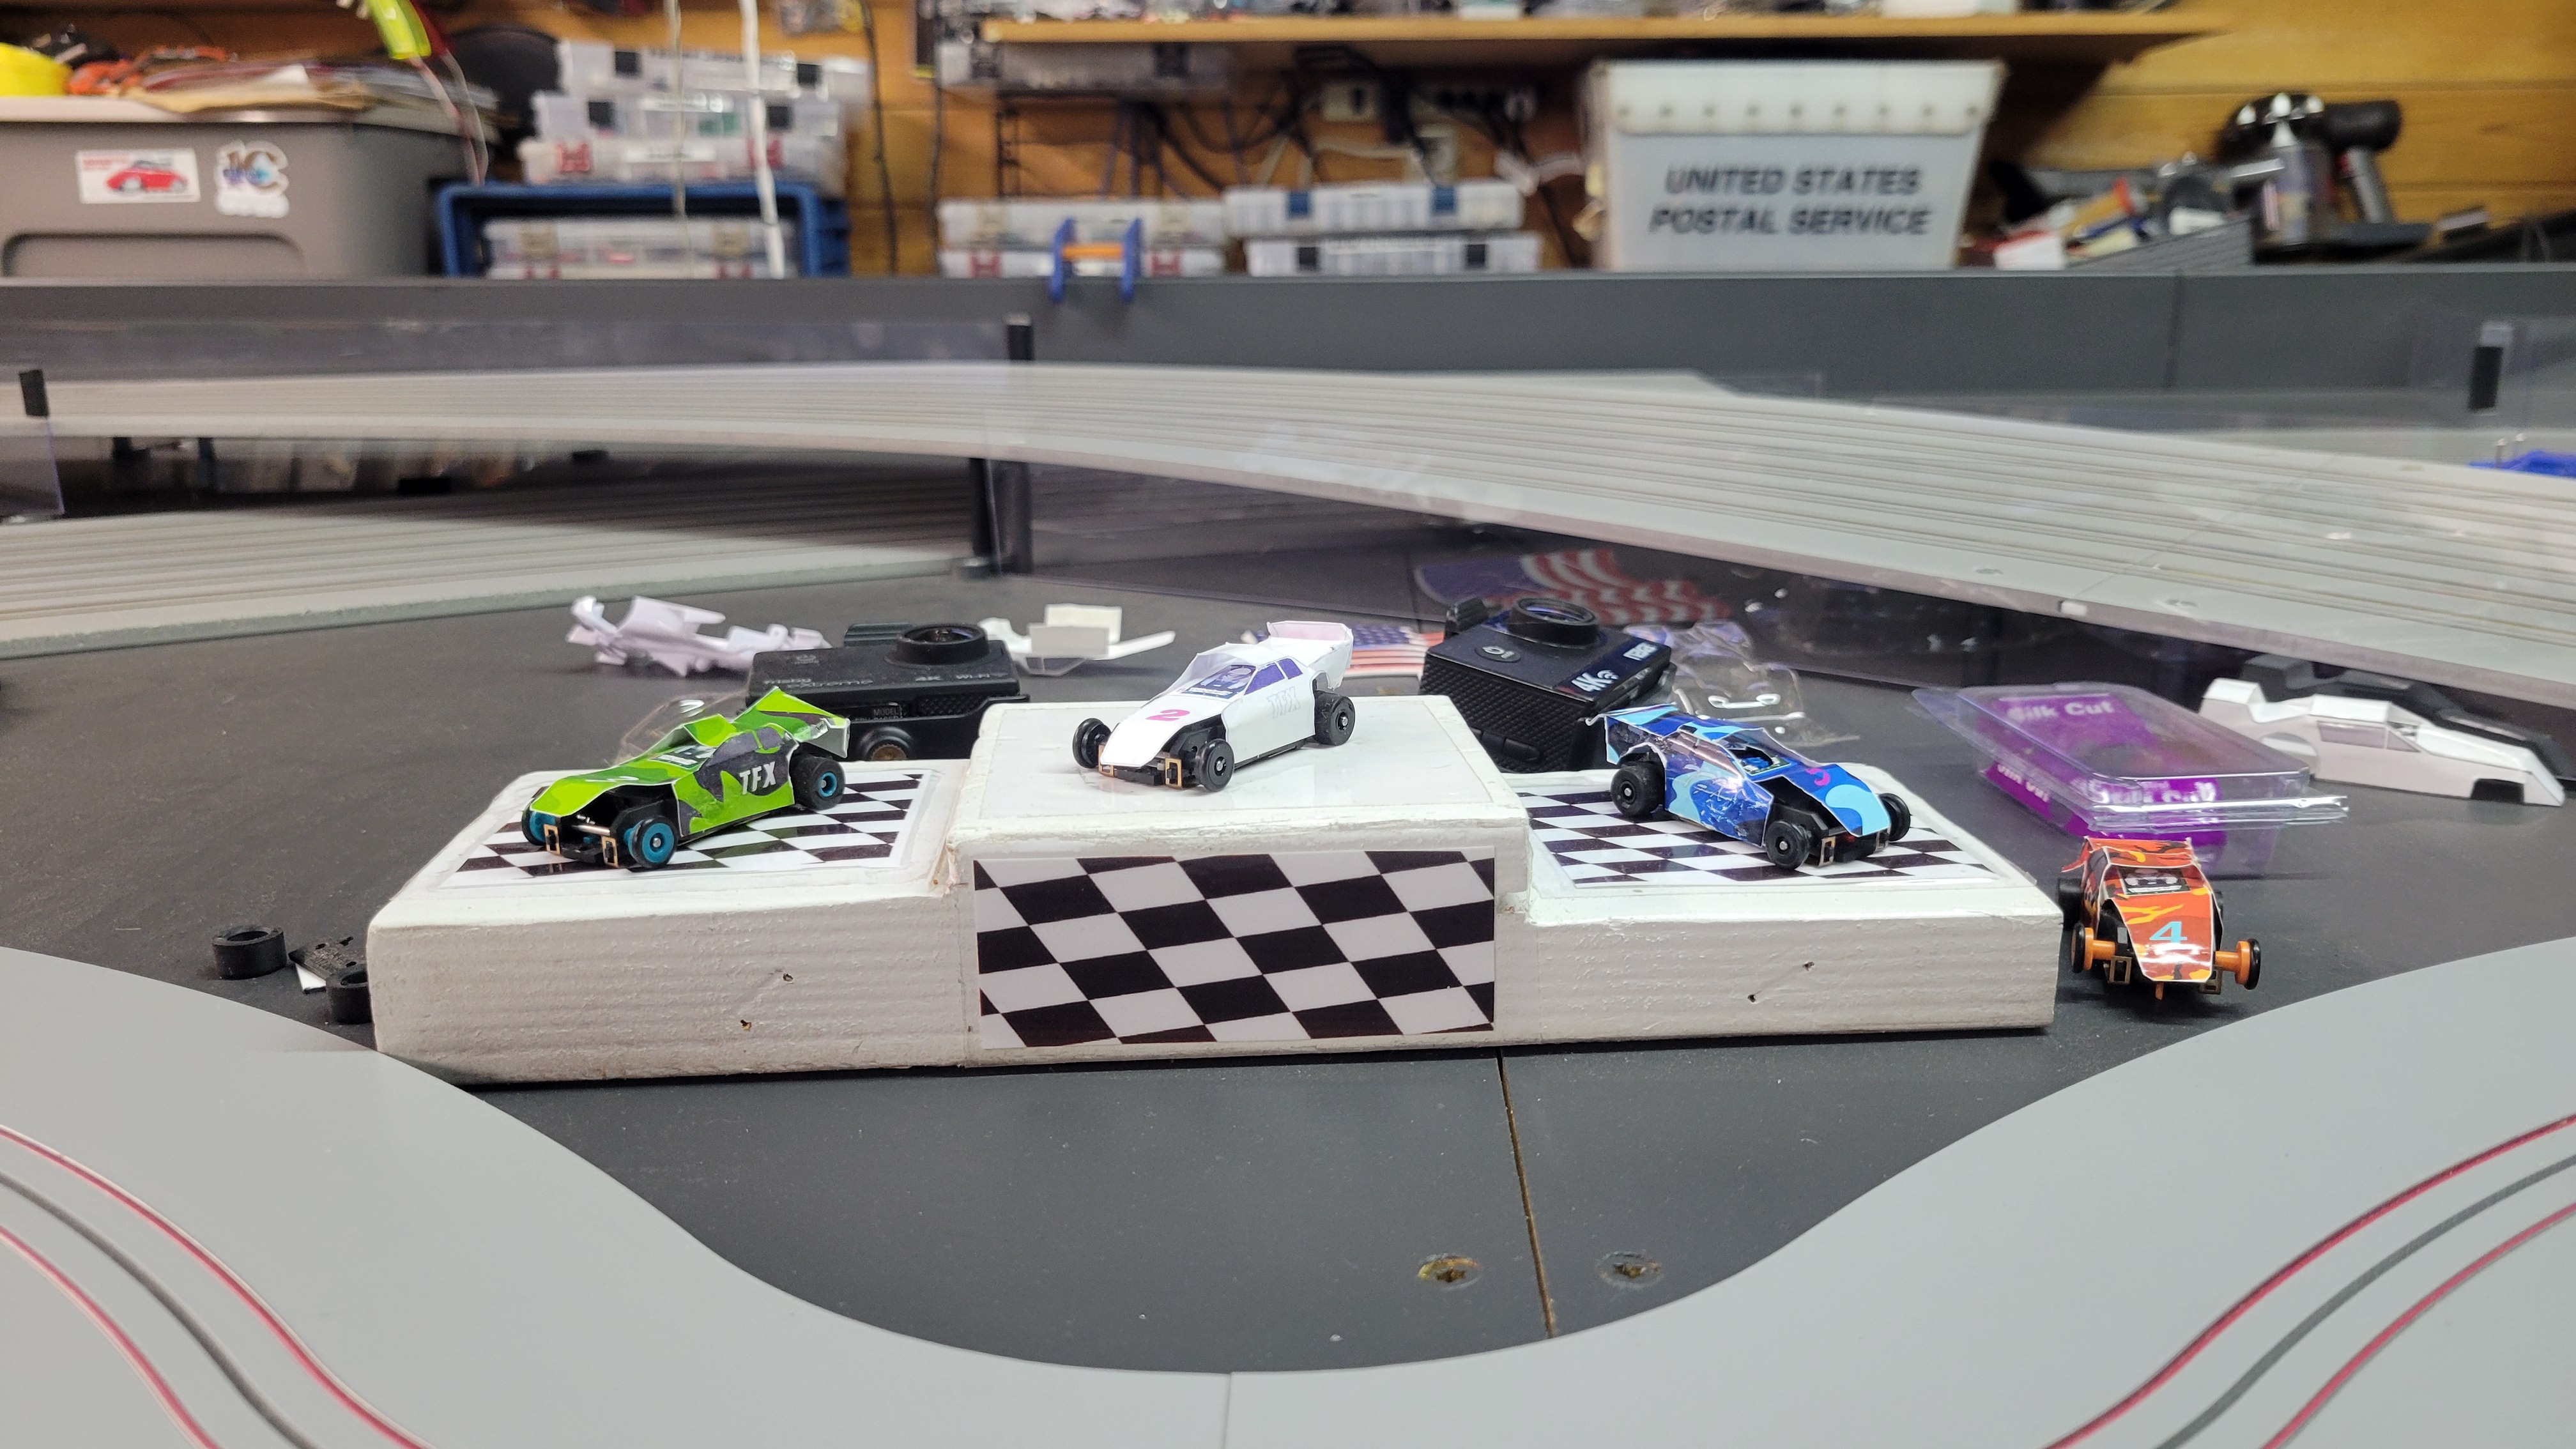
Race Summaries
Race 1: OS3 TFX Lite Paper Midgets on SR3 Oval Super Speedway
Race 1, featuring the OS3 TFX Lite Paper Midgets on the high-speed SR3 Oval Super Speedway, saw Team Jolly Rogers’ John Rogers command the field, taking a decisive victory with an impressive 160 laps. Andy Gersh demonstrated strong consistency, securing third place, while Team Jolley’s Dustin Jolley showed flashes of brilliance, finishing fourth. Dean Donaldson (Full-Speed Racing) rounded out the top five, putting in a solid performance. Kevin Webster (Webster Motorsports) and Joe Clarke (JC Racing) battled hard, reflecting the depth of the field.
| Place | Name | Laps | Points | Total Time |
|---|---|---|---|---|
| 1 | John Rogers | 160 | 61 | 642.634 |
| 2 | Steve Stewart | 157 | 56 | 607.532 |
| 3 | Andy Gersh | 155 | 50 | 669.834 |
| 4 | Dustin Jolley | 153 | 53 | 601.414 |
| 5 | Dean Donaldson | 148 | 54 | 599.705 |
| 6 | Cece Caro | 144 | 46 | 667.997 |
| 7 | Kevin Webster | 128 | 28 | 645.983 |
| 8 | Joe Clarke | 118 | 28 | 620.858 |
View Detailed Race Report: RaceReport_ 192_Jul-30-2026_SR3OvalSuperSpeedway.html
Race 2: MegaG+ Modified 2026 on Stewart Raceway II Straight Road Course
The MegaG+ Modified 2026 class made its highly anticipated debut on Stewart Raceway II (SR2), and it did not disappoint! This new class brings an exciting level of performance and demands precision driving. John Rogers (Team Jolly Rogers) adapted quickly to the new platform, clinching victory with 80 laps and a phenomenal 64 points. Dean Donaldson (Full-Speed Racing) and Dustin Jolley (Team Jolley) battled closely throughout, showcasing their skill in the challenging road course environment. Cece Caro (Team Jolly Rogers) also delivered a strong performance, securing third place.
| Place | Name | Laps | Points | Total Time |
|---|---|---|---|---|
| 1 | John Rogers | 80 | 64 | 368.342 |
| 2 | Steve Stewart | 80 | 61 | 368.792 |
| 3 | Cece Caro | 72 | 47 | 365.335 |
| 4 | Dean Donaldson | 71 | 50 | 401.150 |
| 5 | Dustin Jolley | 71 | 40 | 360.009 |
| 6 | Joe Clarke | 70 | 40 | 407.830 |
| 7 | Andy Gersh | 69 | 42 | 380.638 |
| 8 | Kevin Webster | 61 | 32 | 389.745 |
View Detailed Race Report: RaceReport_ 81_Jul-30-2026_StewartRacewayIIStraightRoadCourse.html
Race 3: U-Build Tomahawks (i) Jolly Rogers on Stewart Raceway II Straight Road Course
The U-Build Tomahawks (i) Jolly Rogers class brought more intense road course action on SR2. John Rogers (Team Jolly Rogers) continued his strong showing, securing second place, just two laps behind the leader. Dean Donaldson (Full-Speed Racing) drove an excellent race to finish third, demonstrating his consistent performance. Andy Gersh put in a determined drive to secure fourth, holding off Team Jolley’s Dustin Jolley who finished fifth. Cece Caro (Team Jolly Rogers) battled hard for sixth.
| Place | Name | Laps | Points | Total Time |
|---|---|---|---|---|
| 1 | Steve Stewart | 80 | 61 | 437.623 |
| 2 | John Rogers | 78 | 52 | 431.434 |
| 3 | Dean Donaldson | 78 | 51 | 448.739 |
| 4 | Andy Gersh | 77 | 44 | 438.724 |
| 5 | Dustin Jolley | 74 | 47 | 454.728 |
| 6 | Cece Caro | 71 | 45 | 453.040 |
| 7 | Joe Clarke | 71 | 42 | 437.901 |
| 8 | Kevin Webster | 65 | 34 | 457.034 |
View Detailed Race Report: RaceReport_ 82_Jul-30-2026_StewartRacewayIIStraightRoadCourse.html
Race 4: Wizzard Storm 22T (i)(o) 16.5v on SR3 Oval Super Speedway
Race 4, featuring the Wizzard Storm 22T class, proved to be the most dramatic of the night. Andy Gersh put in an outstanding performance to claim second, only two laps behind the leader, while Team Jolly Rogers’ John Rogers took third. Team Jolley’s Dustin Jolley kept the pressure on in fourth, and Dean Donaldson (Full-Speed Racing) secured fifth.
The turning point for John Rogers came in Segment 5. While Rogers put in strong segment performances earlier, his crash in Segment 5 had a notable impact on his overall standing for this particular race. A self-inflicted crash, whether due to driver error, an aggressive maneuver, or a mechanical issue, often results in lost time and laps. In slot car racing, as in many forms of motorsport, maintaining a clean race is paramount, and any incident that causes a car to de-slot can lead to significant penalties in terms of lost momentum and laps, directly affecting the final results. This incident highlights the fine line between pushing for speed and maintaining control, a challenge every driver faces. Team Jolly Rogers’ Cece Caro also showed her resilience by securing sixth place.
| Place | Name | Laps | Points | Total Time |
|---|---|---|---|---|
| 1 | Steve Stewart | 159 | 58 | 413.435 |
| 2 | Andy Gersh | 157 | 46 | 410.829 |
| 3 | John Rogers | 156 | 54 | 410.037 |
| 4 | Dustin Jolley | 156 | 51 | 423.245 |
| 5 | Dean Donaldson | 154 | 42 | 416.083 |
| 6 | Cece Caro | 145 | 46 | 425.714 |
| 7 | Kevin Webster | 126 | 32 | 407.319 |
View Detailed Race Report: RaceReport_ 193_Jul-30-2026_SR3OvalSuperSpeedway.html
New Track Records Set During This Event
A remarkable fourteen new track records were set during this thrilling event, a testament to the drivers’ skill and the intense competition!
| Track | Class | Lane | Driver | Lap Time | Type |
|---|---|---|---|---|---|
| Stewart Raceway II Straight Road Course | MegaG+ Modified 2026 | 1 | John Rogers | 3681 | Race |
| Stewart Raceway II Straight Road Course | MegaG+ Modified 2026 | 2 | John Rogers | 3498 | Race |
| Stewart Raceway II Straight Road Course | MegaG+ Modified 2026 | 3 | John Rogers | 3435 | Race |
| Stewart Raceway II Straight Road Course | MegaG+ Modified 2026 | 4 | John Rogers | 3702 | Race |
| Stewart Raceway II Straight Road Course | U-Build Tomahawks (i) Jolly Rogers | 1 | John Rogers | 4398 | Race |
| Stewart Raceway II Straight Road Course | U-Build Tomahawks (i) Jolly Rogers | 2 | Cece Caro | 4101 | Race |
| Stewart Raceway II Straight Road Course | U-Build Tomahawks (i) Jolly Rogers | 3 | Dean Donaldson | 4321 | Race |
| Stewart Raceway II Straight Road Course | U-Build Tomahawks (i) Jolly Rogers | 4 | Dean Donaldson | 4312 | Race |
| SR3 Oval Super Speedway | OS3 TFX Lite Paper Midgets | 2 | Dean Donaldson | 3072 | Race |
| SR3 Oval Super Speedway | OS3 TFX Lite Paper Midgets | 3 | John Rogers | 3227 | Race |
| SR3 Oval Super Speedway | OS3 TFX Lite Paper Midgets | 4 | John Rogers | 3223 | Race |
| SR3 Oval Super Speedway | OS3 TFX Lite Paper Midgets | 5 | Steve Stewart | 3185 | Race |
| SR3 Oval Super Speedway | Wizzard Storm 22T (i)(o) 16.5v | 2 | Cece Caro | 1639 | Race |
| SR3 Oval Super Speedway | Wizzard Storm 22T (i)(o) 16.5v | 3 | John Rogers | 2124 | Race |
| SR3 Oval Super Speedway | Wizzard Storm 22T (i)(o) 16.5v | 4 | Andy Gersh | 1900 | Race |
| SR3 Oval Super Speedway | Wizzard Storm 22T (i)(o) 16.5v | 5 | Cece Caro | 1790 | Race |
John Rogers (Team Jolly Rogers) dominated the record books, setting multiple fastest laps across both the new MegaG+ Modified class on Stewart Raceway II and the OS3 TFX Lite Paper Midgets on the SR3 Oval. His teammate Cece Caro also showcased her speed with two new records, including an incredibly fast 1.639-second lap in the Wizzard Storm 22T class on SR3 Oval Lane 2. Dean Donaldson (Full-Speed Racing) contributed significantly with new records in both the U-Build Tomahawks and OS3 TFX Lite Paper Midgets classes. Andy Gersh also etched his name in the record books for the Wizzard Storm 22T class, and Steve Stewart secured a new record in the OS3 TFX Lite Paper Midgets class. These achievements underscore the extraordinary talent and relentless pursuit of speed by all competitors.
Looking Ahead
This Thursday Night “Under The Lights” Round 4 proved to be an exhilarating chapter in the 2026 season. The intensity of competition, especially the captivating duel between Steve Stewart and John Rogers across multiple races, keeps fans on the edge of their seats. The debut of the MegaG+ Modified class on SR2 also promises exciting future developments. Drivers will undoubtedly be back for Round 5, eager to reclaim lost laps and push for victory, with the shadow of John Rogers’ Race 4 incident serving as a stark reminder of the unforgiving nature of championship slot car racing.
Overall Standings After Round 4 Summary
The overall standings reflect a season of intense competition across all divisions. John Rogers leads the Masters after Round 4, a testament to his consistent performance despite the recent track incident. The introduction of the MG+ Modified class is expected to further challenge drivers and elevate the racing experience. Due to the nature of the provided overall standings, detailed lap time analysis to filter potential “rider” laps is not feasible within this report.
Master Division Standings
| Place | Name | Laps | Points |
|---|---|---|---|
| 1 | John Rogers | 1576 | 838 |
| 2 | Steve Stewart | 1544 | 820 |
| 3 | Dustin Jolley | 1511 | 738 |
| 4 | Dean Donaldson | 1504 | 740 |
| 5 | Cece Caro | 1467 | 670 |
| 6 | Joe Clarke | 920 | 339 |
| 7 | Kevin Webster | 653 | 248 |
Advanced Division Standings
| Place | Name | Laps | Points |
|---|---|---|---|
| 1 | Andy Gersh | 757 | 352 |
Amateur Division Standings
| Place | Name | Laps | Points |
|---|---|---|---|
| 1 | Tracker Clay | 447 | 119 |
| 2 | Trakker Clay | 148 | 74 |
| 3 | Rad Raca | 123 | 68 |
| 4 | Bobby Graham | 118 | 70 |
Analysis of John Rogers’ Crash in Race 4, Segment 5
John Rogers’ performance in Race 4 was impacted by a critical incident in Segment 5. The segment length was 40 laps, but John Rogers only completed 39 laps in this segment, placing him 3rd for the segment with 11 points. This suggests a loss of one lap, consistent with a crash or de-slotting event.
Let’s analyze the impact of this lost lap on his final standing:
- Current Standing: John Rogers finished 3rd overall in Race 4 with 156 total laps and 54 points.
- Segment 5 Performance: In Segment 5, John Rogers recorded an average lap time of 2.890, while Steve Stewart (1st in segment, 40 laps) had 2.807 and Andy Gersh (2nd in segment, 40 laps) had 2.668. Based on these times, even if Rogers had completed 40 laps, his total segment run time would likely have been slower than Stewart and Gersh, meaning he would still have placed 3rd in the segment and earned 11 points.
- Hypothetical Scenario (No Lost Lap): If John Rogers had completed the full 40 laps in Segment 5, his total laps for Race 4 would have increased from 156 to 157. His total points would likely remain at 54 (assuming he still earned 11 points for finishing 3rd in that segment).
Impact on Final Position:
- Original Final Standings (Laps, Points):
- 1st: Steve Stewart (159 Laps, 58 Points)
- 2nd: Andy Gersh (157 Laps, 46 Points)
- 3rd: John Rogers (156 Laps, 54 Points)
- 4th: Dustin Jolley (156 Laps, 51 Points)
- Hypothetical Final Standings (with +1 lap for John Rogers):
- 1st: Steve Stewart (159 Laps, 58 Points)
- 2nd: John Rogers (157 Laps, 54 Points)
- 3rd: Andy Gersh (157 Laps, 46 Points)
- 4th: Dustin Jolley (156 Laps, 51 Points)
Conclusion: The loss of one lap in Segment 5 due to the crash was significant. It caused John Rogers to finish 3rd instead of a potential 2nd place. While he would have been tied on laps with Andy Gersh (157), his superior total points (54 vs. 46) would have placed him higher. This incident highlights how a single misstep can drastically alter race outcomes, especially in tightly contested fields.
I’ll get a video of the incident up on Rumble ASAP.
View Detailed Race Report: RaceReport_ 193_Jul-30-2026_SR3OvalSuperSpeedway.html
⚠️ End of AI‑generated content.