The Crash

In the final race of July 30’s “Under the Lights” event, a significant crash occurred as drivers exited Turn 4 on the SR3 Oval in Segment 5. This crash impacted literally every driver in that segment.

During the crash, the deslotted car in the Blue lane passed under the scoring gantry on its lid, triggering a lap for the driver in the White lane. While still spinning, the car was hit at full speed by the car actually in the White lane, causing that car to de-slot and come to a stop on the Orange lane. That car was then plowed into by the car in the Orange lane at full speed.  All of this occurred before the race director halted the race and cut the power.

A lot of very impactful things happened as a result of the Blue lane car deslotting:

      1. The Blue lane did not get their lap.
      2. The spinning Blue lane car triggered an early record lap for the White lane driver.
      3. The White lane car crashed hard into the slowly but still spinning Blue lane car and de-slotted, coming to a stop in the middle of the Orange lane.
      4. The Orange lane and Green lane cars both picked up a lap during the crash.
      5. The Orange lane car then slammed into the White Lane car and also de-slotted with an “Out-of-body” experience.

All the above things happened before the power was cut and the segment halted.

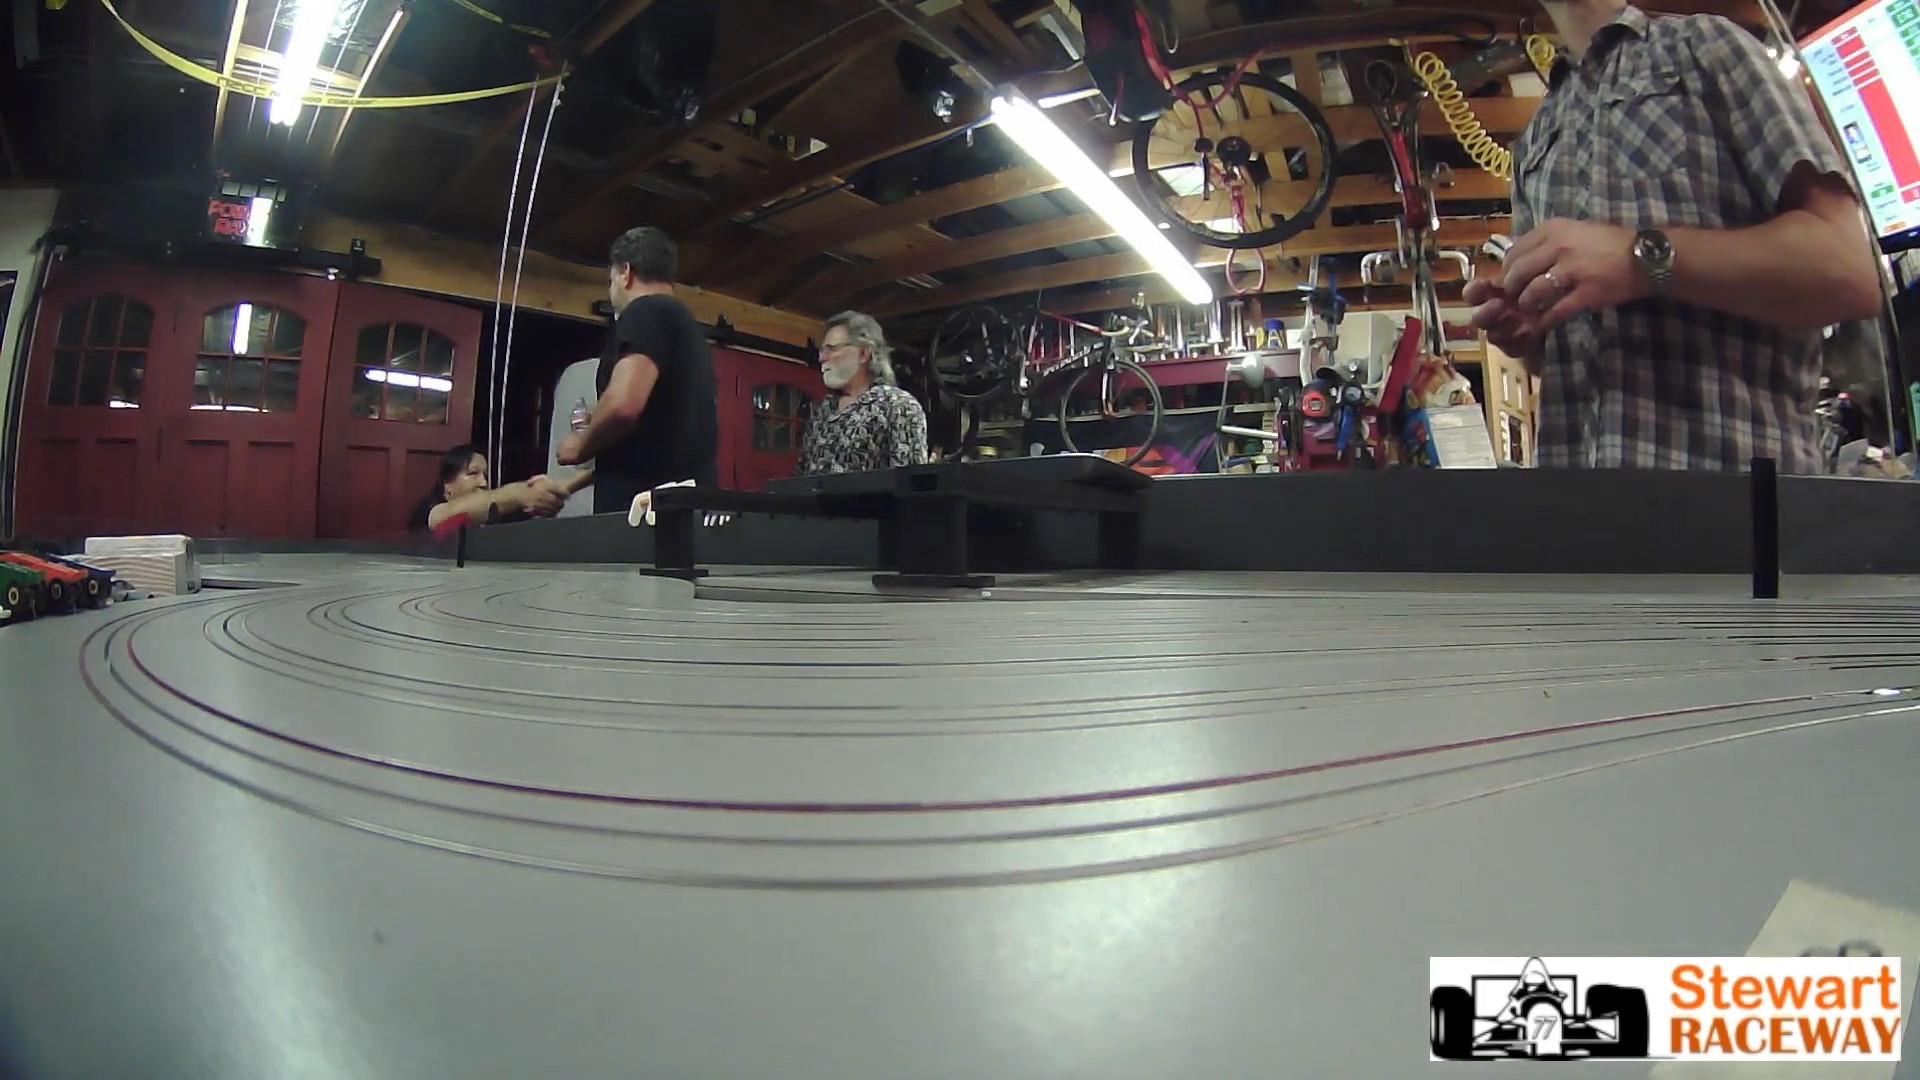
As the HOPRA rules below have long supported, the expectation of most drivers present was to allow the Blue lane car to regain its “missed” lap by placing the crashed car behind the scoring gantry, near where it de-slotted, and restarting. Which, as you can see in the video, was attempted.

However, the Orange and Green lane drivers disagreed with the expectation that the Blue lane car should be allowed to regain the lap it had lost.

The general consensus was pretty much a toss-up, and the track owner decided not to count the lap, and the segment and race continued. Of course, the Blue lane driver and others were not pleased with the decision.

The track owner’s reasoning was that allowing the Blue lane car to get the lap back essentially negated any negative impact on the crashing driver while significantly negatively impacting all the other drivers.

Key HOPRA Rule on Missed Laps / De-SlotsFrom HOPRA Racing Rules and Procedures (section covering de-slots and lap counting):

      • The only penalty for a de-slot (car coming out of the slot) is the time lost while a marshal replaces it.
      • A driver shall not be penalized a loss of lap(s) if their car misses the lap counter due to a de-slot or improper marshalling.
      • A driver shall not gain a lap if another car passes over their lap counter for the same reason.
      • Recognition of a missed (or extra) lap must come from an official marshal or Race Director.
      • If a car misses the counter, the Race Director adds the deserved lap to the driver’s total during or at the end of the segment.
      • If a track marshal verifies a missed or added lap, they notify the Race Director to correct the count.

In short, missed laps caused by de-slots or marshaling errors are corrected (added back) rather than left as permanent penalties. The time cost of being off-track is considered sufficient.

The keywords in the HOPRA rules are “The time cost of being off-track is considered sufficient.” In this case, there would be no time cost. Only the laps lost and the distance lost by all three of the other drivers who did not crash.

I’m sure this type of incident has been encountered before and will certainly happen again. To avoid future frustration and anger, a specific rule will be created to properly address this type of situation going forward.

View the video on Rumble here.

Just before this final race got underway, I was thinking to myself how much fun it has been racing with the Thursday Night “Under the Lights” bunch.

It is not fun when folks leave Stewart Raceway angry and/or frustrated.

Thursday Night “Under The Lights” Round 4: Sparks Fly as Champions Emerge, and One Crash Shifts the Tides on Jul-30-2026!

⚠️ This report was primarily generated by an AI model.⚠️

Jul-30-2026 – The racing world was on the edge of its collective seat last Thursday night as Stewart Raceway once again delivered a high-octane spectacle in Round 4 of its “Under The Lights” series. The evening was packed with breathtaking speed, strategic prowess, and a dramatic turn of events, including a controversial crash involving Team Jolly Rogers’ John Rogers in segment 5 of Race 4, that left a lasting impact on the night’s standings. The debut of the new MG+ Modified class on Stewart Raceway II (SR2) added an extra layer of excitement, showcasing the cutting edge of slot car performance.

Race Summaries

Race 1: OS3 TFX Lite Paper Midgets on SR3 Oval Super Speedway

Race 1, featuring the OS3 TFX Lite Paper Midgets on the high-speed SR3 Oval Super Speedway, saw Team Jolly Rogers’ John Rogers command the field, taking a decisive victory with an impressive 160 laps. Andy Gersh demonstrated strong consistency, securing third place, while Team Jolley’s Dustin Jolley showed flashes of brilliance, finishing fourth. Dean Donaldson (Full-Speed Racing) rounded out the top five, putting in a solid performance. Kevin Webster (Webster Motorsports) and Joe Clarke (JC Racing) battled hard, reflecting the depth of the field.

Place Name Laps Points Total Time
1 John Rogers 160 61 642.634
2 Steve Stewart 157 56 607.532
3 Andy Gersh 155 50 669.834
4 Dustin Jolley 153 53 601.414
5 Dean Donaldson 148 54 599.705
6 Cece Caro 144 46 667.997
7 Kevin Webster 128 28 645.983
8 Joe Clarke 118 28 620.858

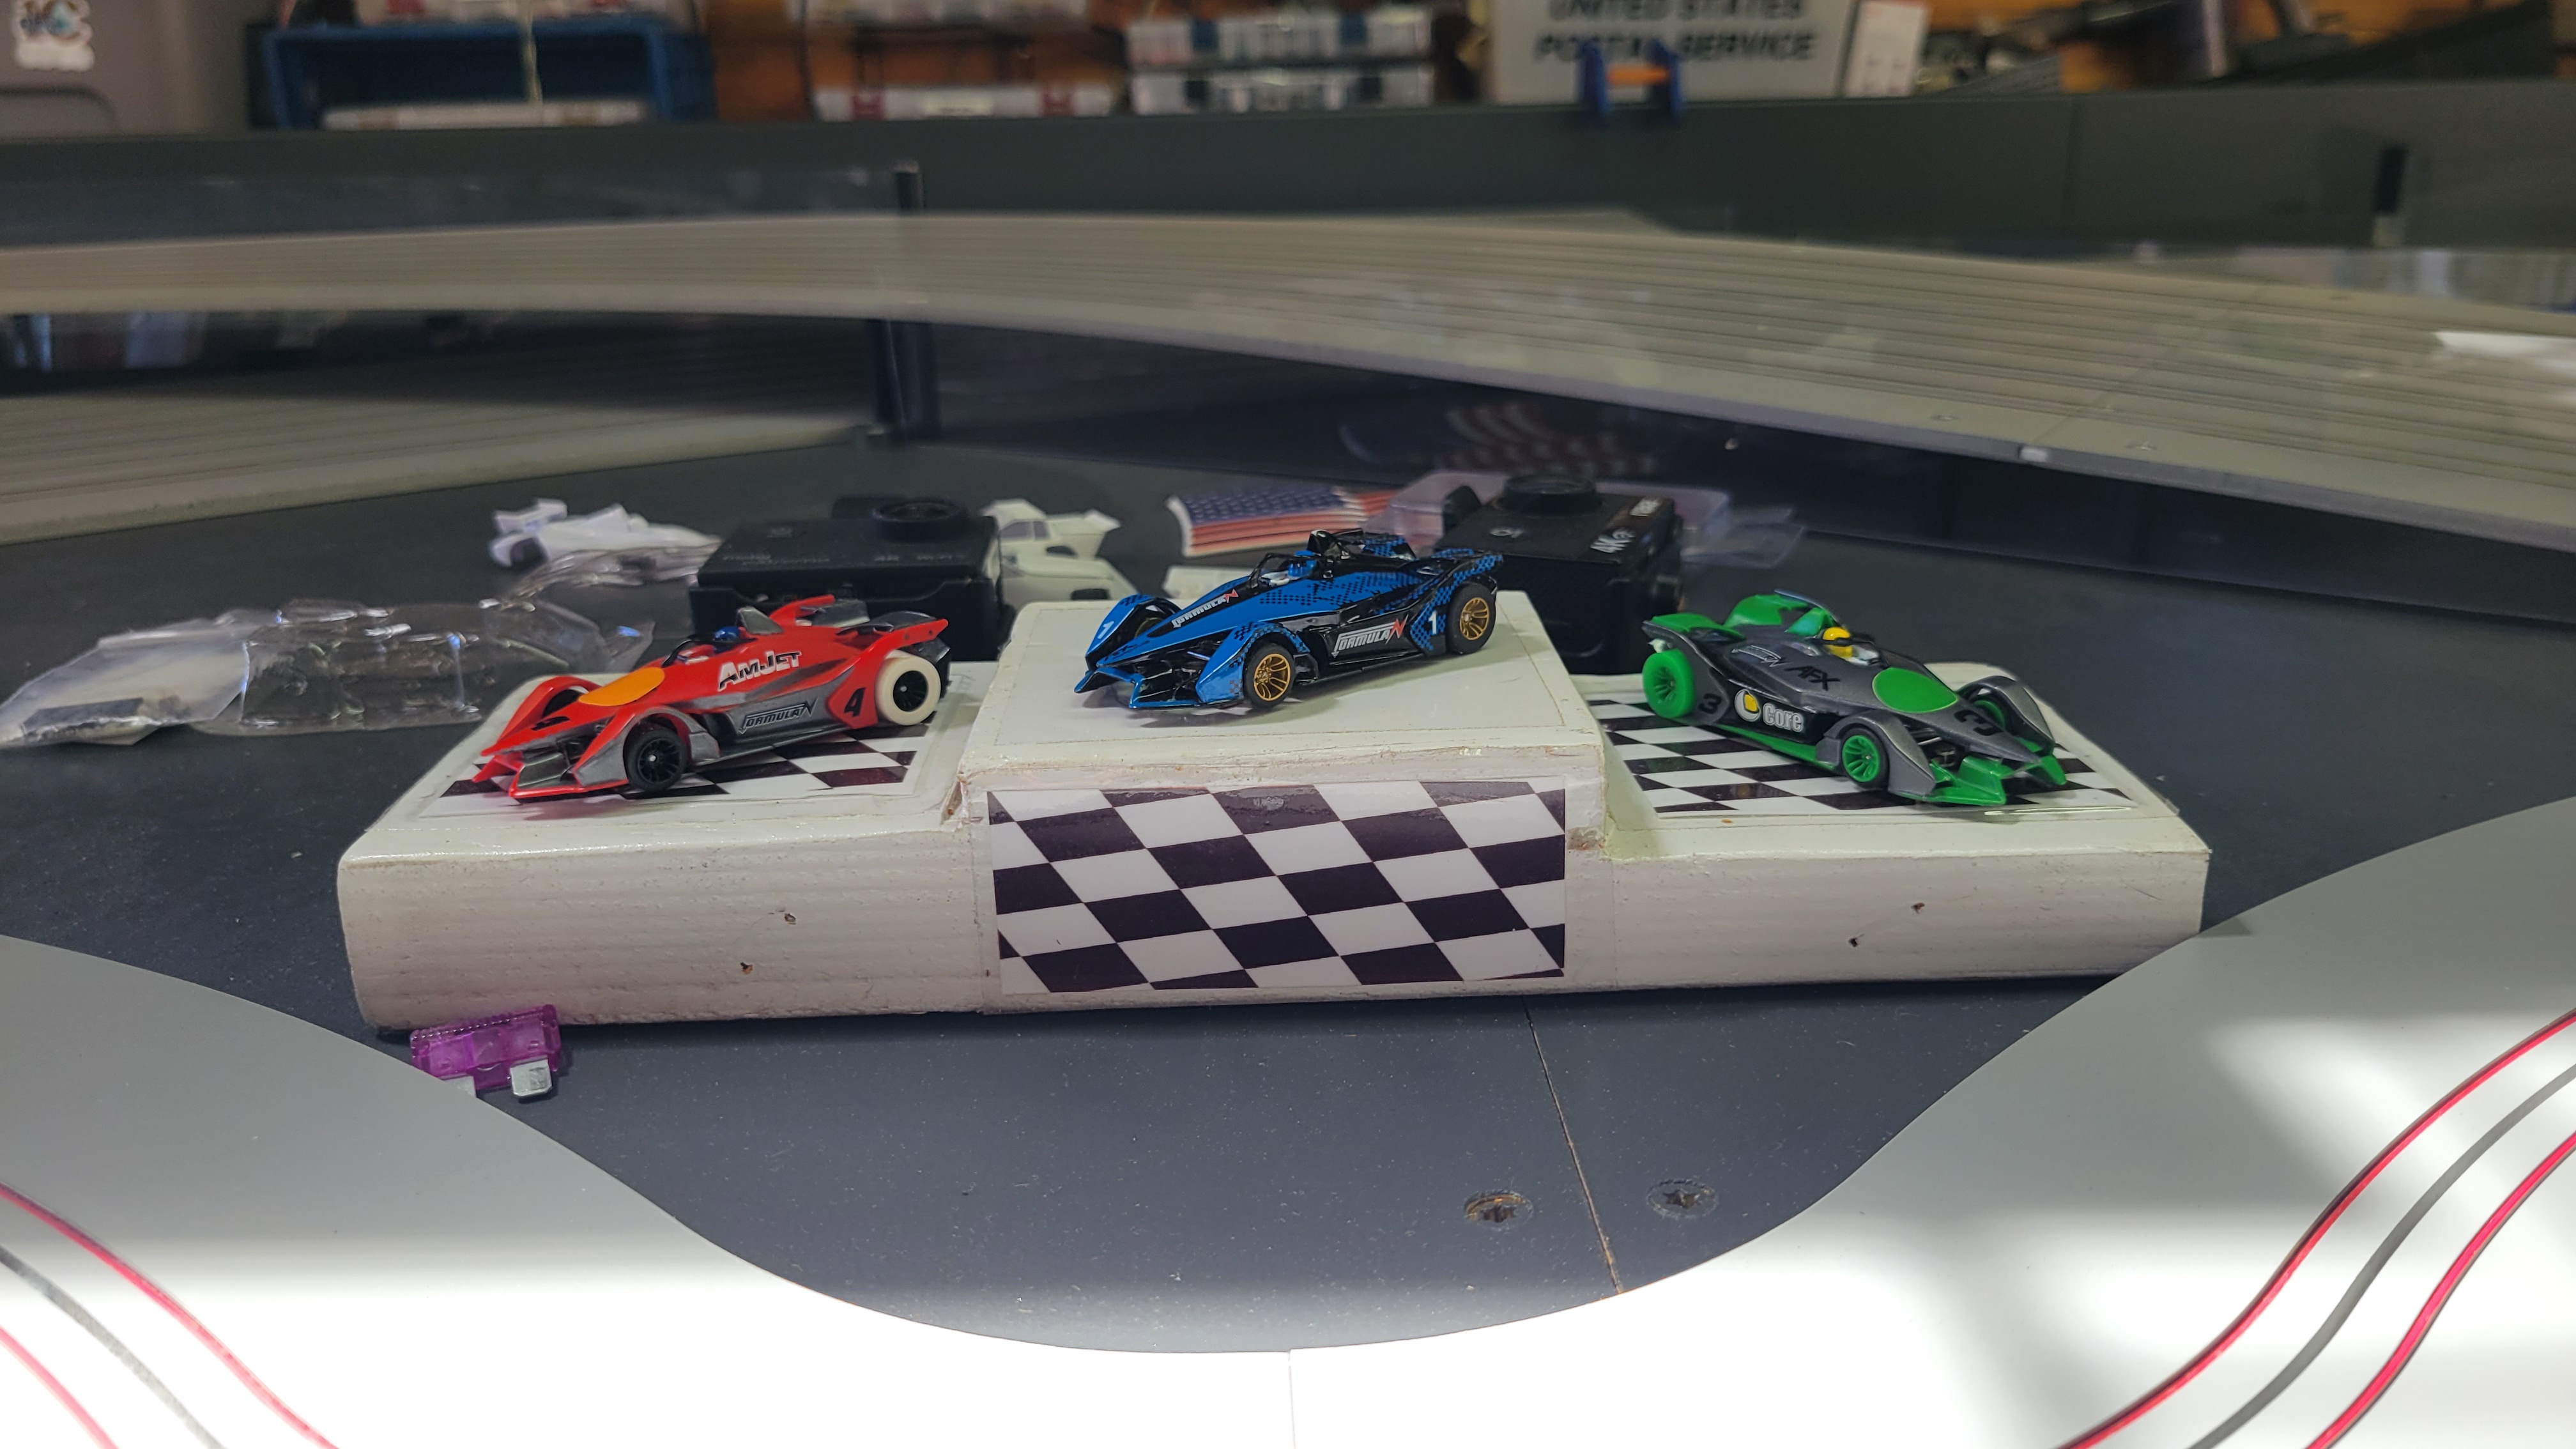
Event Photo for Race 1

View Detailed Race Report: RaceReport_ 192_Jul-30-2026_SR3OvalSuperSpeedway.html

Race 2: MegaG+ Modified 2026 on Stewart Raceway II Straight Road Course

The MegaG+ Modified 2026 class made its highly anticipated debut on Stewart Raceway II (SR2), and it did not disappoint! This new class brings an exciting level of performance and demands precision driving. John Rogers (Team Jolly Rogers) adapted quickly to the new platform, clinching victory with 80 laps and a phenomenal 64 points. Dean Donaldson (Full-Speed Racing) and Dustin Jolley (Team Jolley) battled closely throughout, showcasing their skill in the challenging road course environment. Cece Caro (Team Jolly Rogers) also delivered a strong performance, securing third place.

Place Name Laps Points Total Time
1 John Rogers 80 64 368.342
2 Steve Stewart 80 61 368.792
3 Cece Caro 72 47 365.335
4 Dean Donaldson 71 50 401.150
5 Dustin Jolley 71 40 360.009
6 Joe Clarke 70 40 407.830
7 Andy Gersh 69 42 380.638
8 Kevin Webster 61 32 389.745

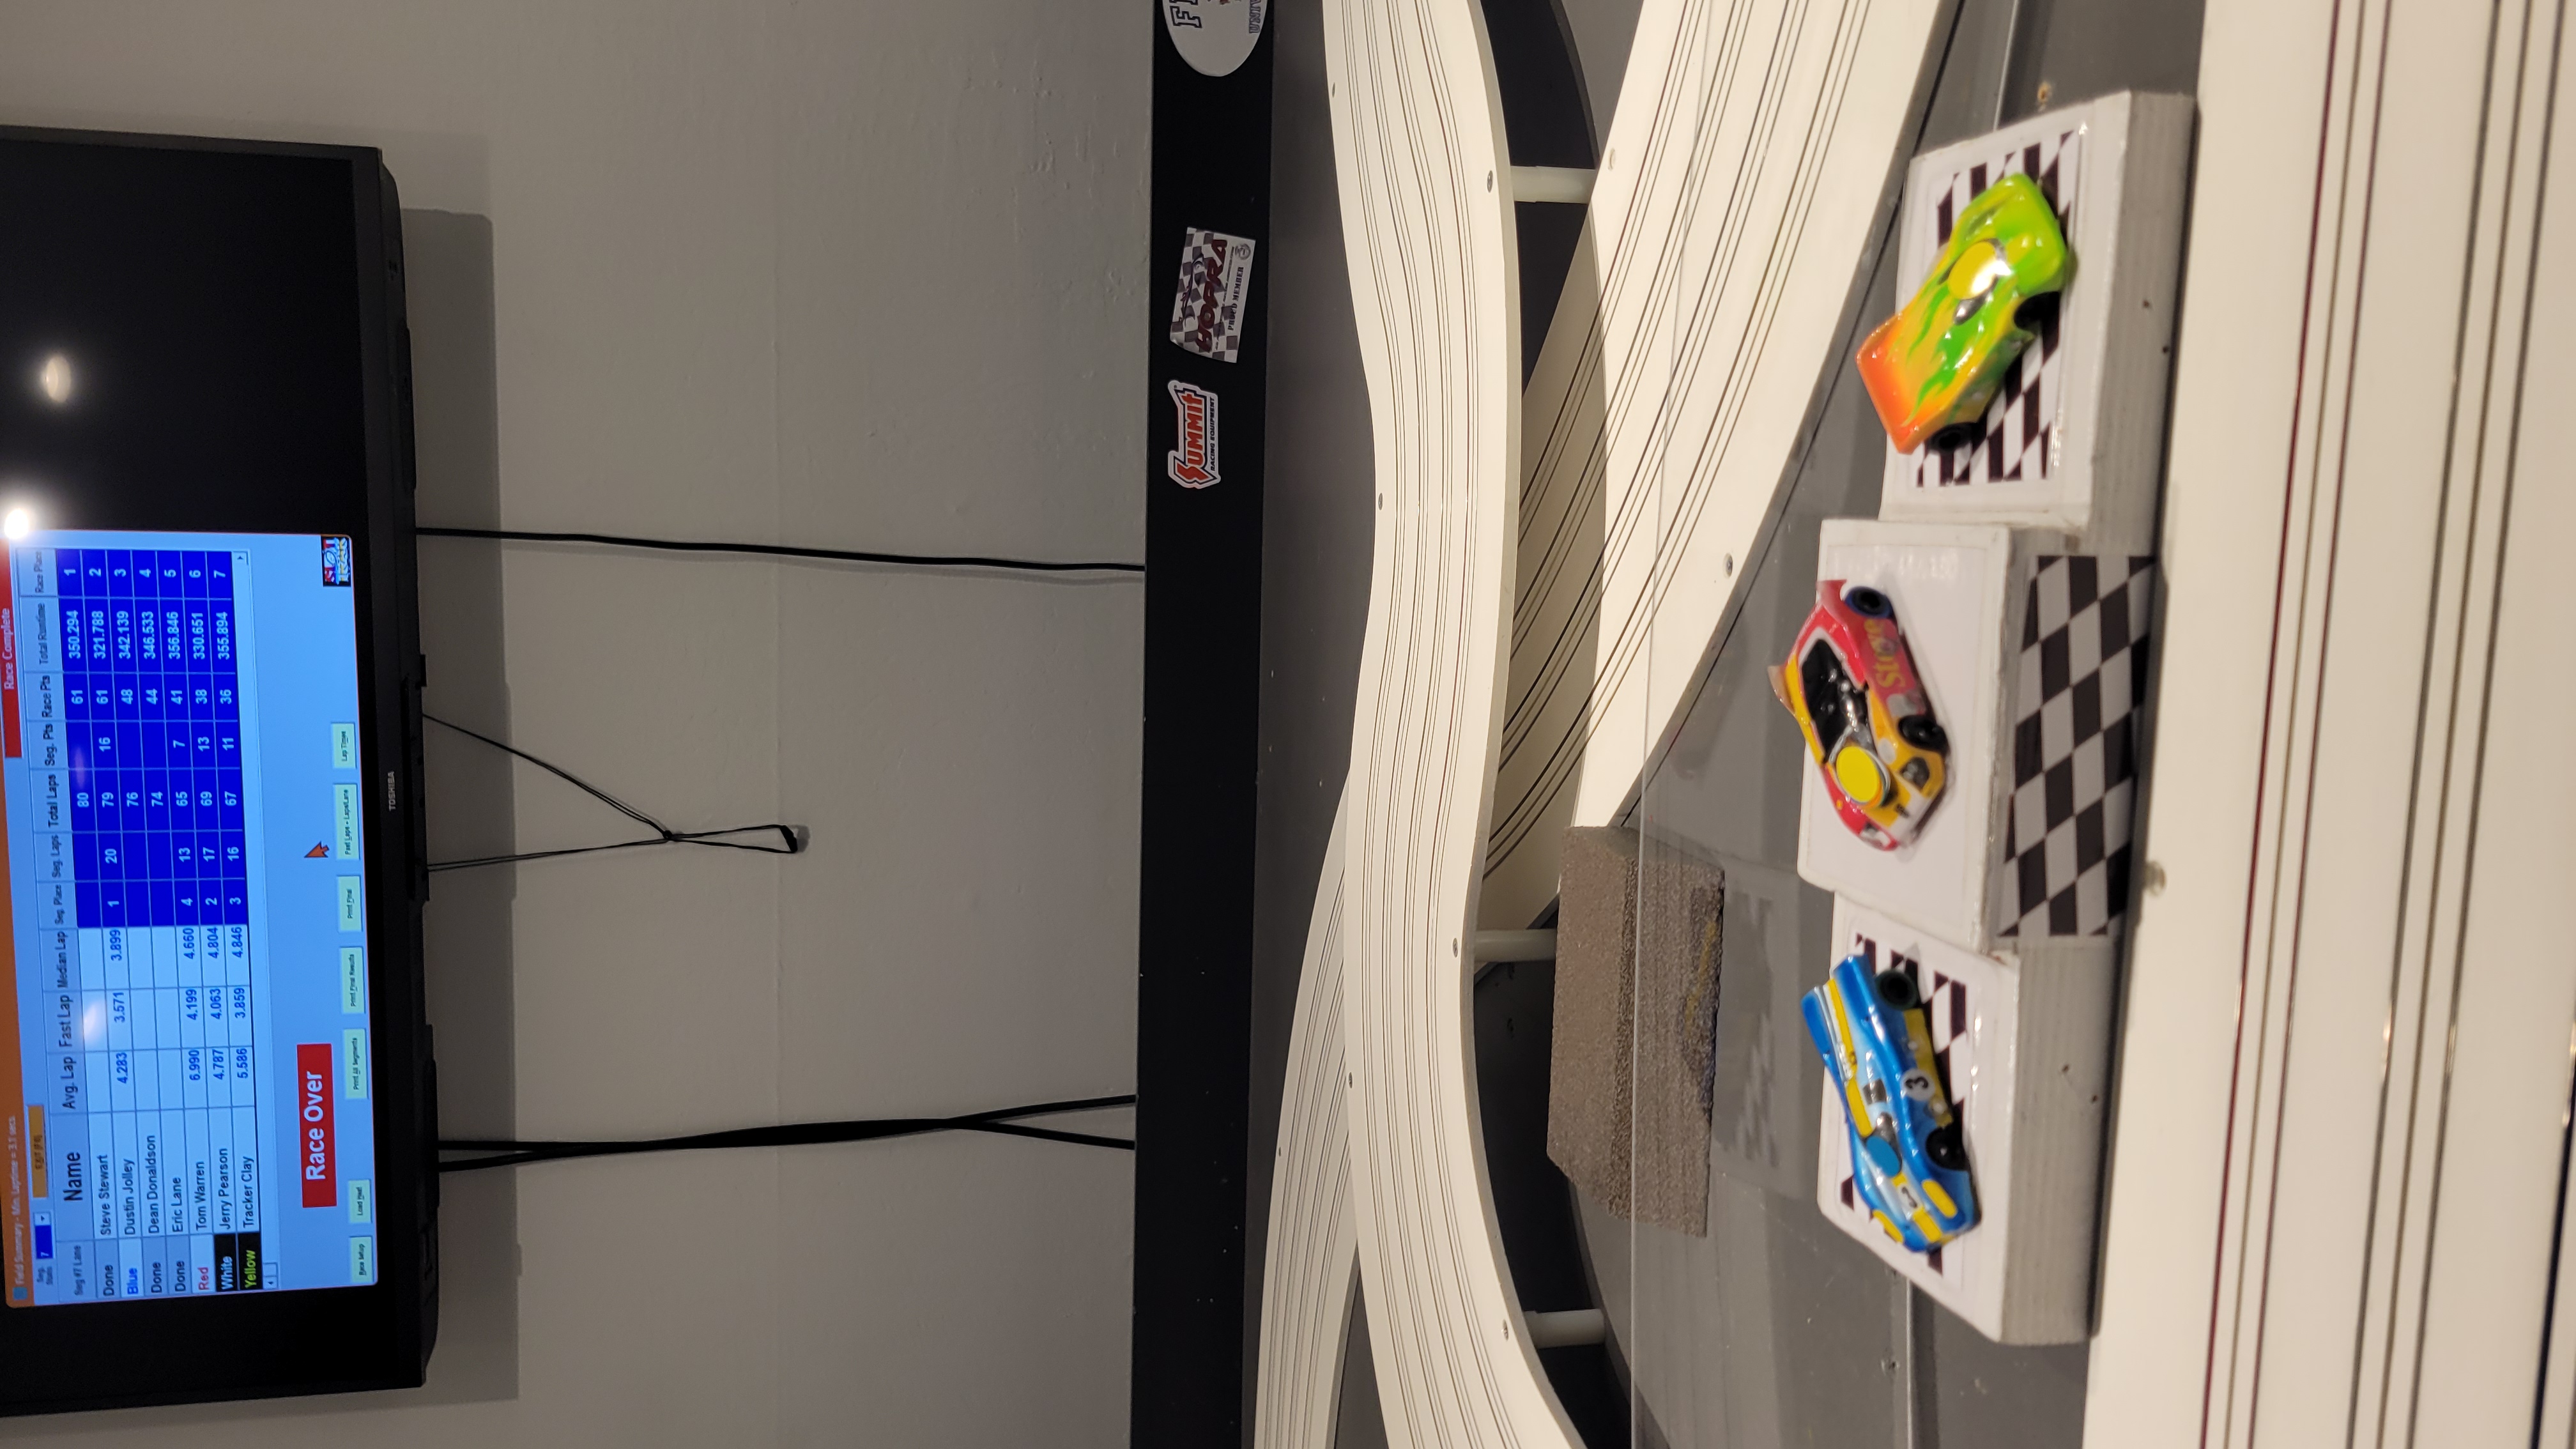
Event Photo for Race 2

View Detailed Race Report: RaceReport_ 81_Jul-30-2026_StewartRacewayIIStraightRoadCourse.html

Race 3: U-Build Tomahawks (i) Jolly Rogers on Stewart Raceway II Straight Road Course

The U-Build Tomahawks (i) Jolly Rogers class brought more intense road course action on SR2. John Rogers (Team Jolly Rogers) continued his strong showing, securing second place, just two laps behind the leader. Dean Donaldson (Full-Speed Racing) drove an excellent race to finish third, demonstrating his consistent performance. Andy Gersh put in a determined drive to secure fourth, holding off Team Jolley’s Dustin Jolley who finished fifth. Cece Caro (Team Jolly Rogers) battled hard for sixth.

Place Name Laps Points Total Time
1 Steve Stewart 80 61 437.623
2 John Rogers 78 52 431.434
3 Dean Donaldson 78 51 448.739
4 Andy Gersh 77 44 438.724
5 Dustin Jolley 74 47 454.728
6 Cece Caro 71 45 453.040
7 Joe Clarke 71 42 437.901
8 Kevin Webster 65 34 457.034

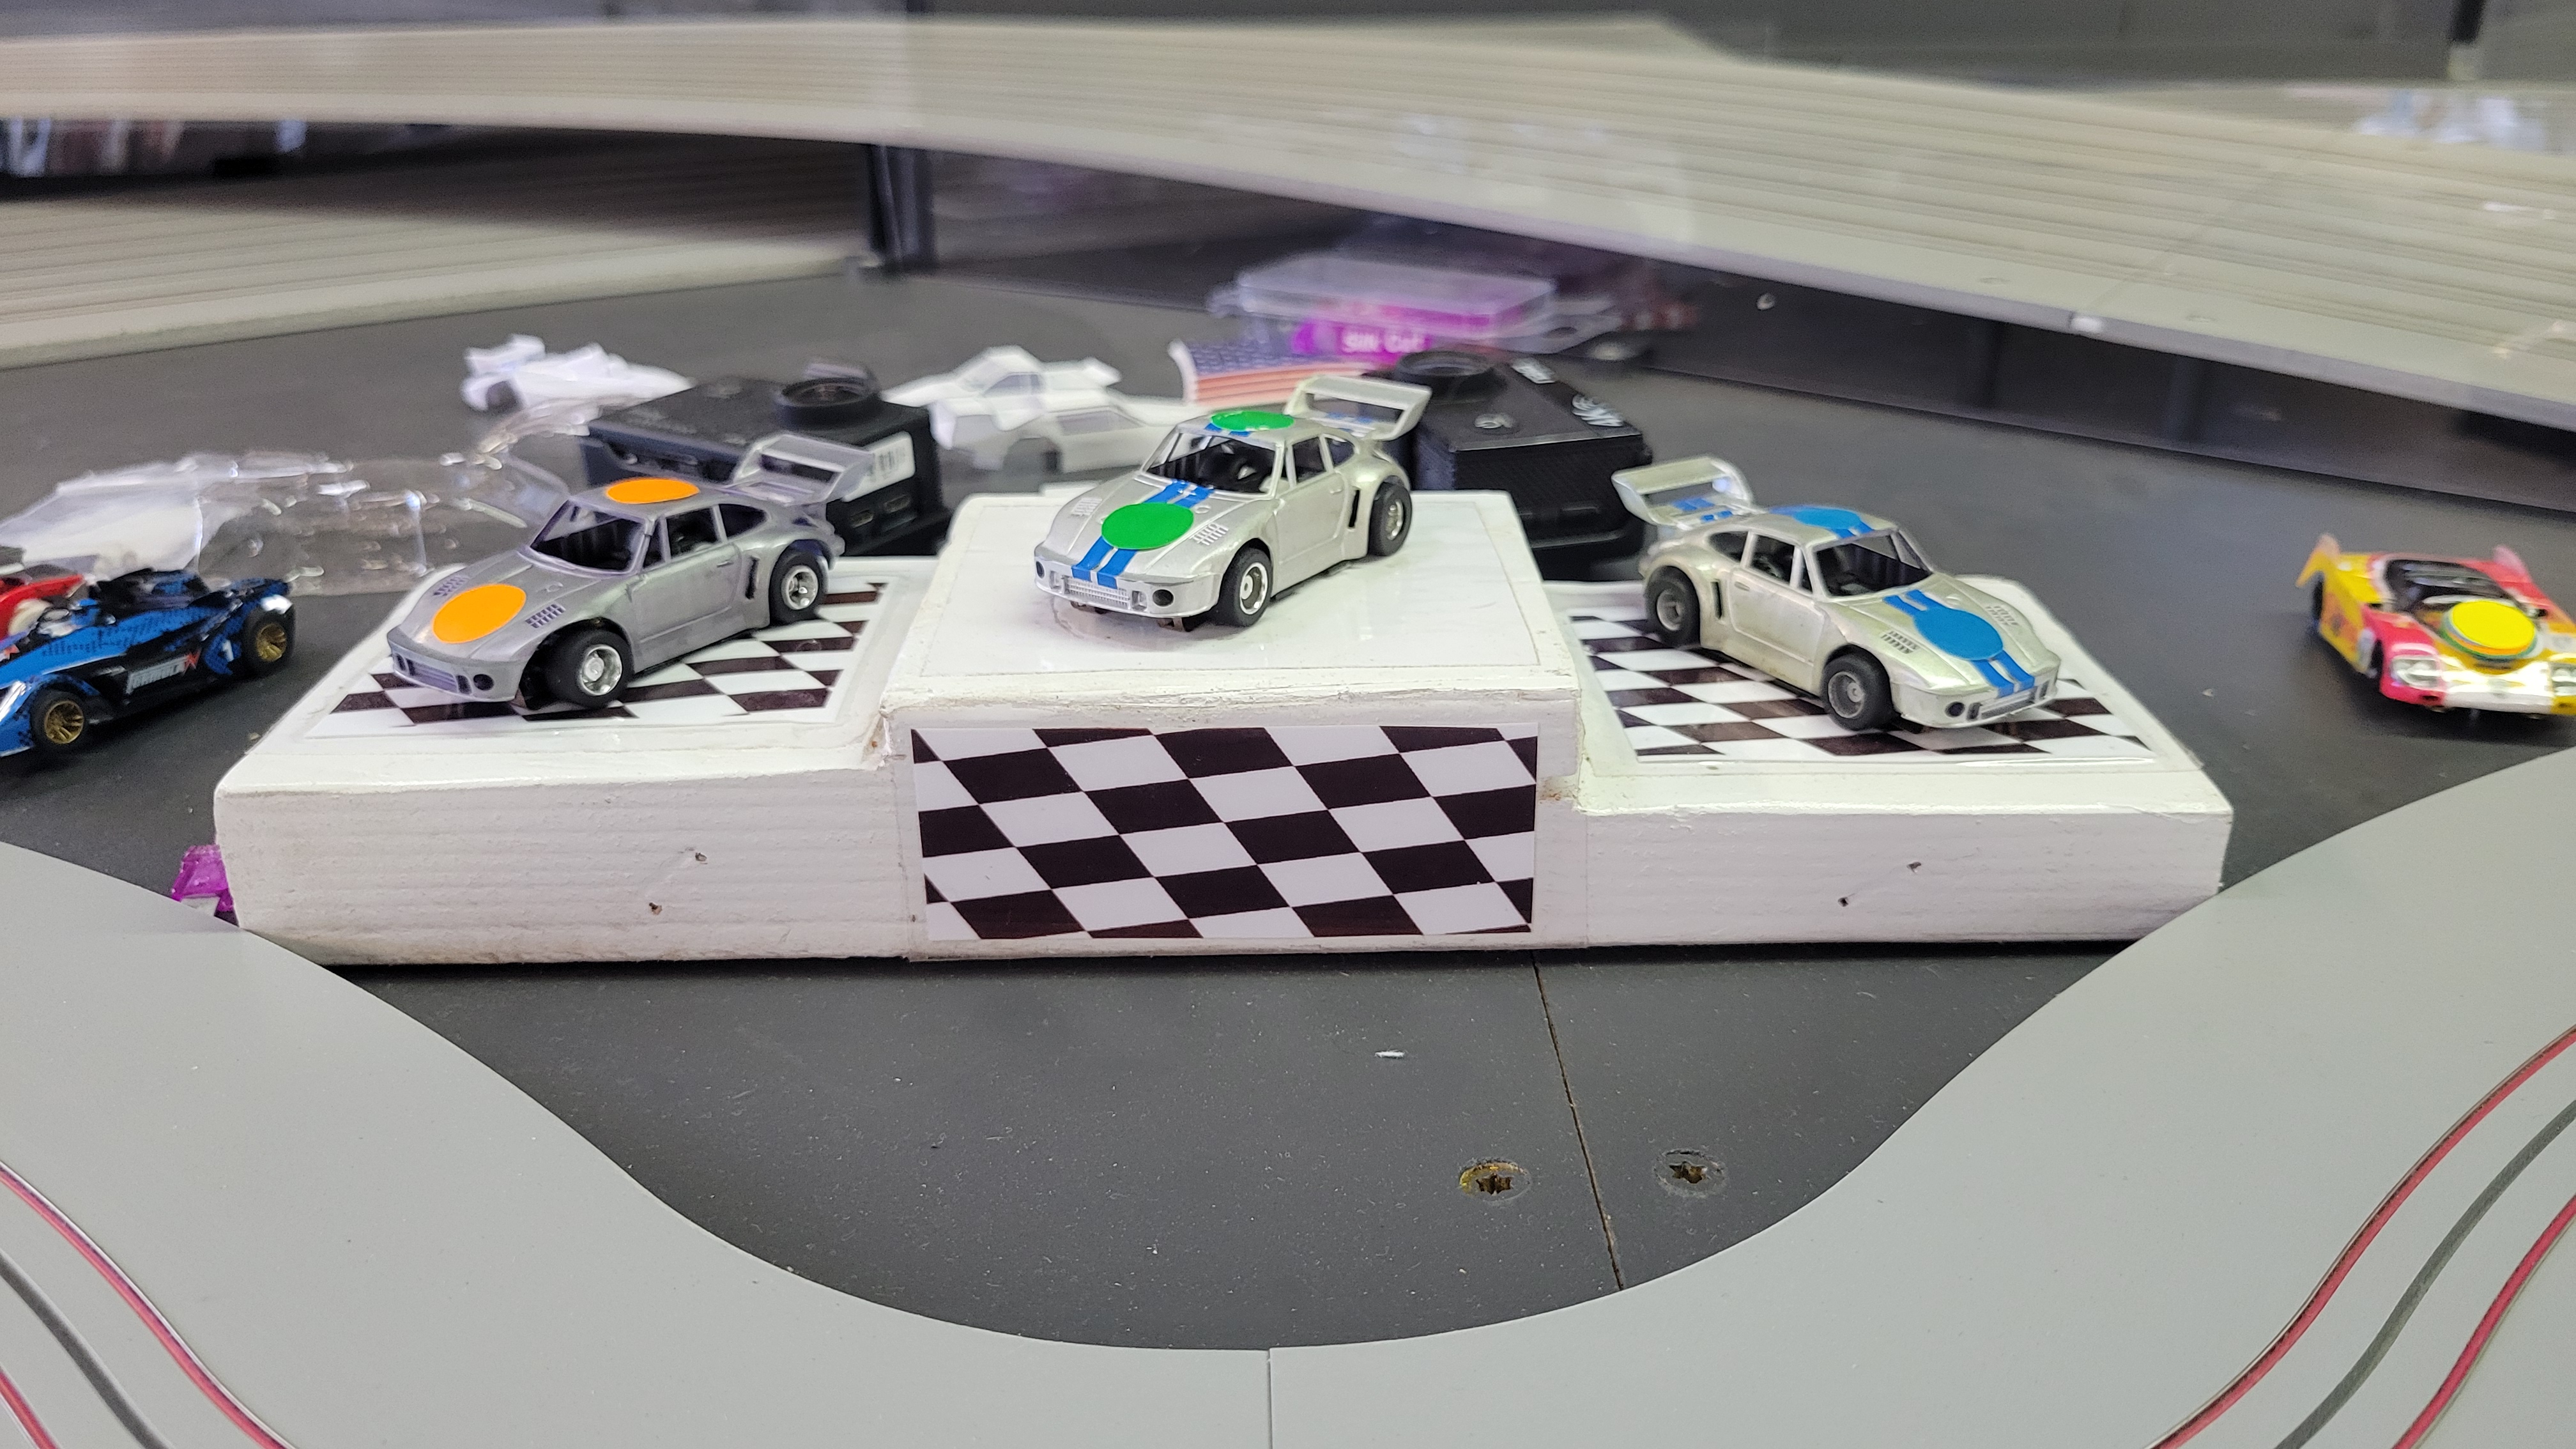
Event Photo for Race 3

View Detailed Race Report: RaceReport_ 82_Jul-30-2026_StewartRacewayIIStraightRoadCourse.html

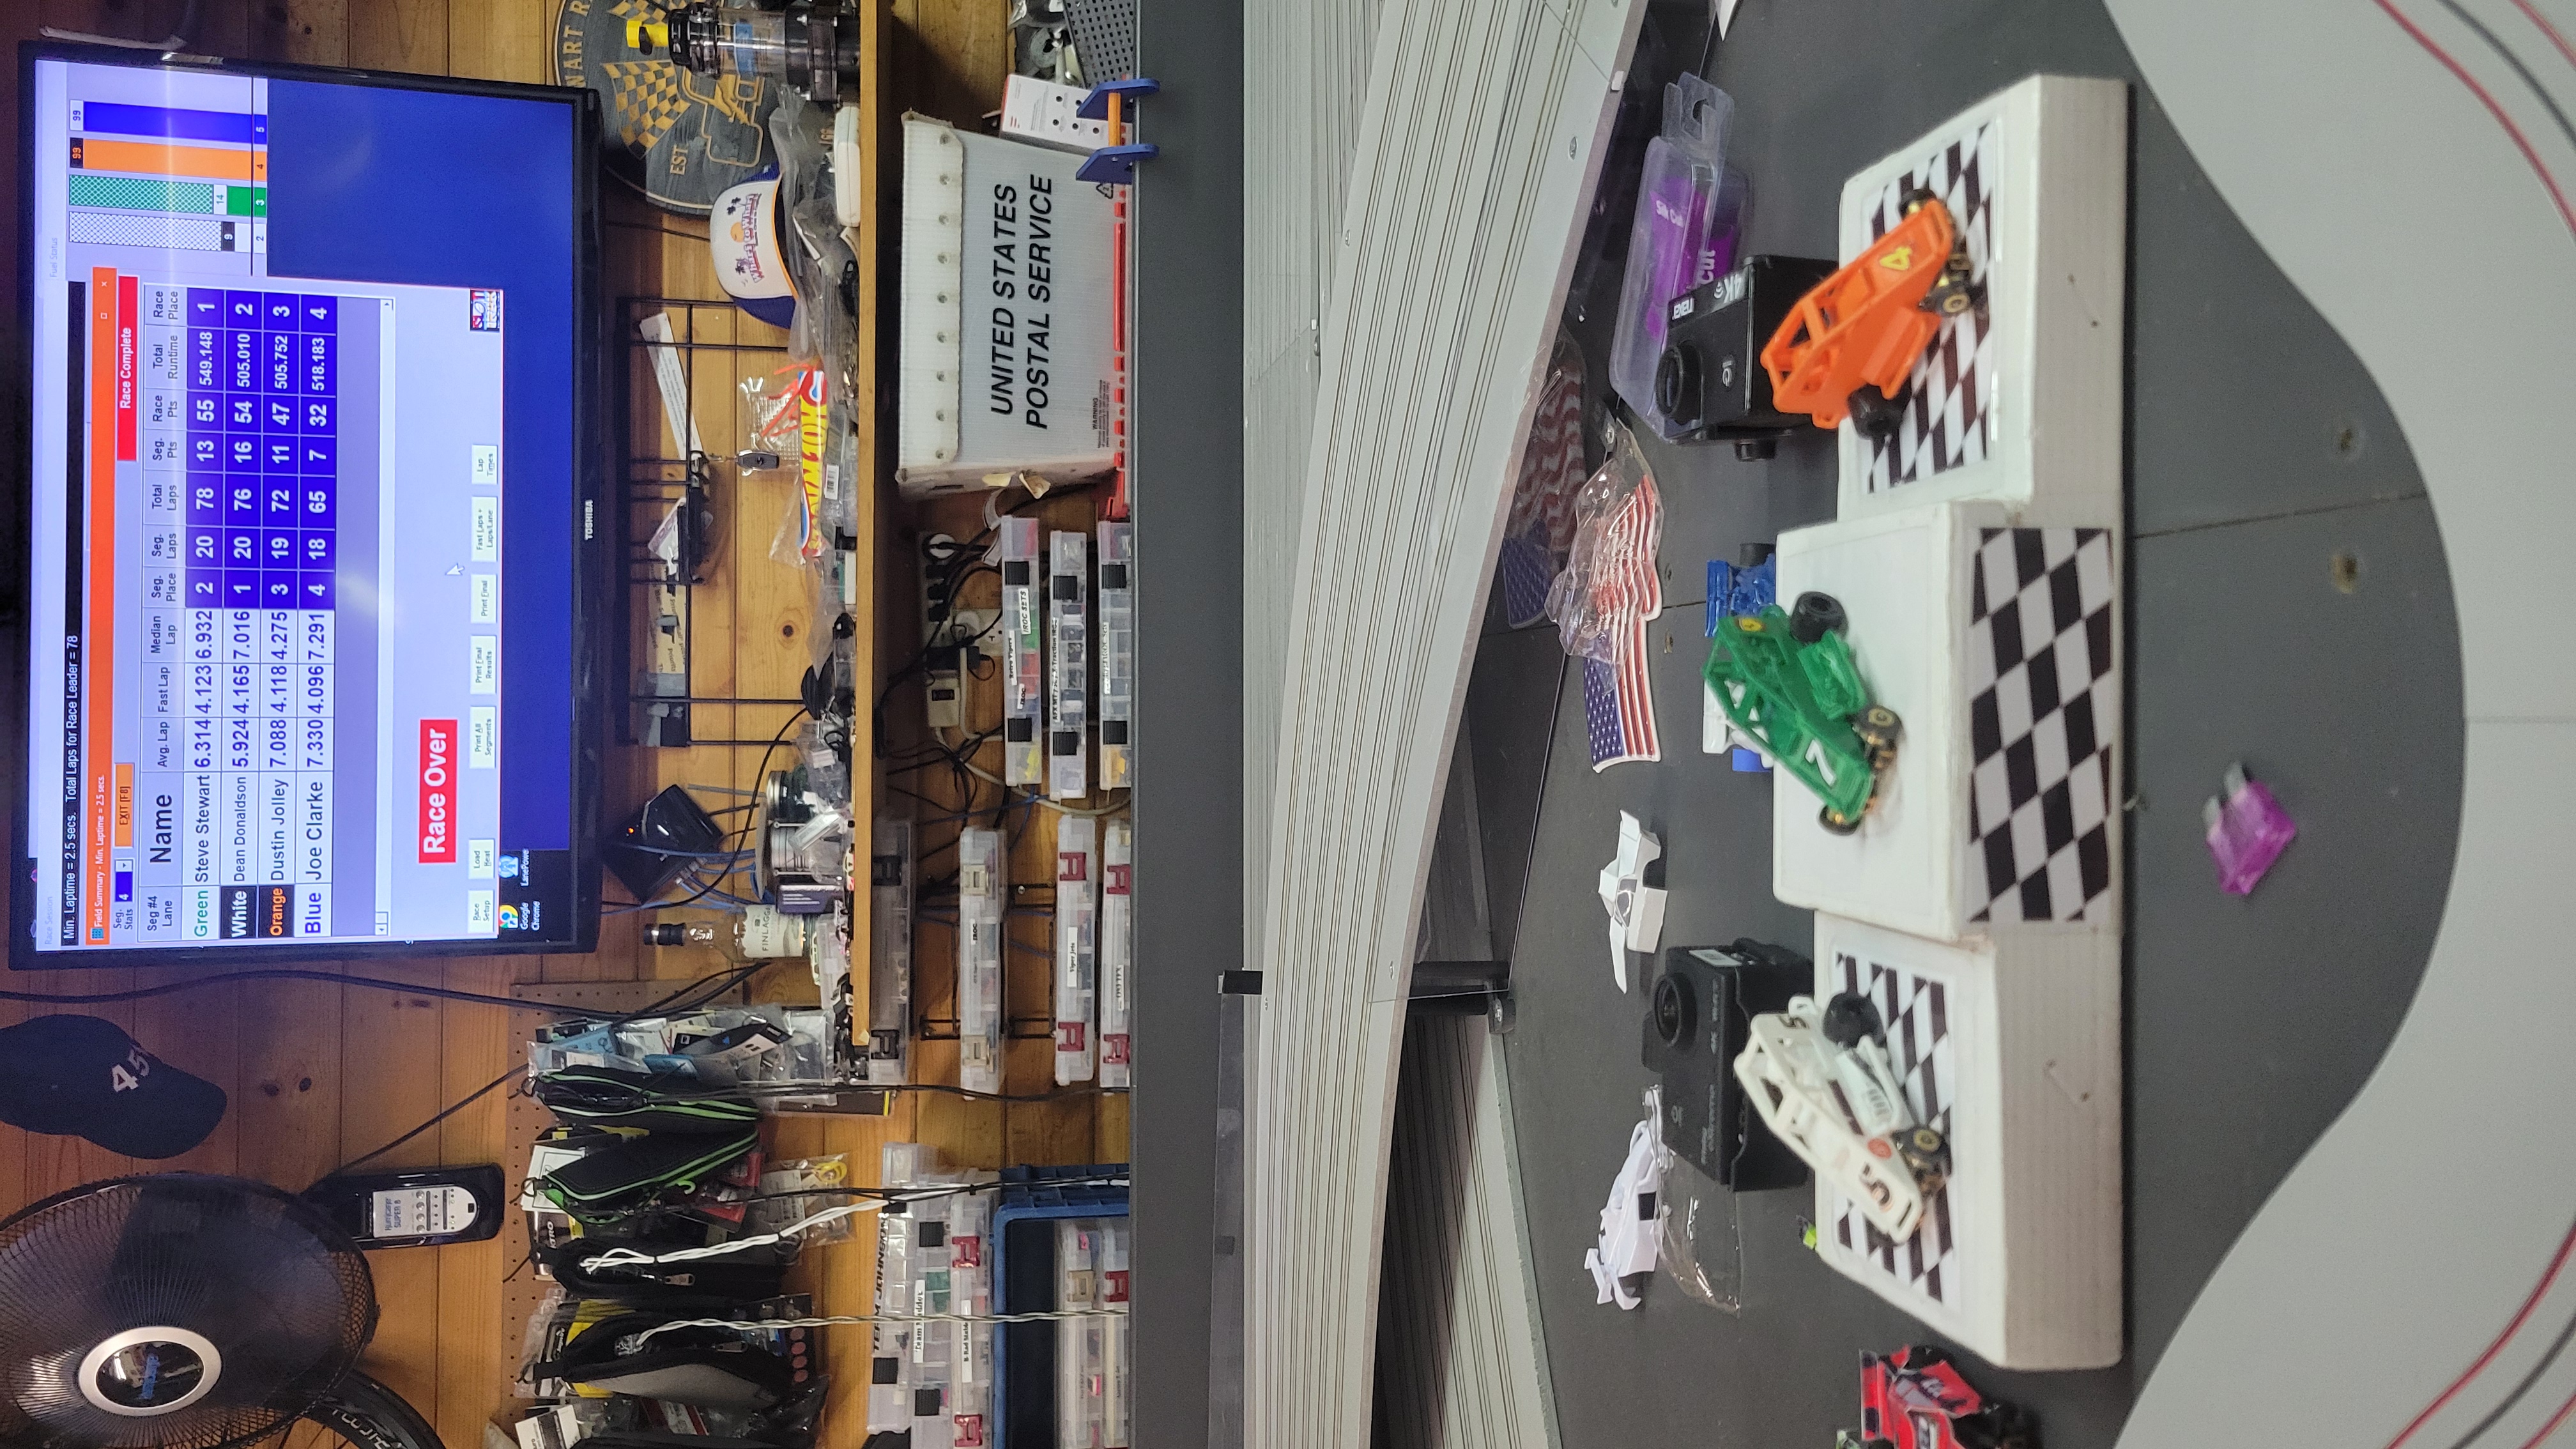
Race 4: Wizzard Storm 22T (i)(o) 16.5v on SR3 Oval Super Speedway

Race 4, featuring the Wizzard Storm 22T class, proved to be the most dramatic of the night. Andy Gersh put in an outstanding performance to claim second, only two laps behind the leader, while Team Jolly Rogers’ John Rogers took third. Team Jolley’s Dustin Jolley kept the pressure on in fourth, and Dean Donaldson (Full-Speed Racing) secured fifth.

The turning point for John Rogers came in Segment 5. While Rogers put in strong segment performances earlier, his crash in Segment 5 had a notable impact on his overall standing for this particular race. A self-inflicted crash, whether due to driver error, an aggressive maneuver, or a mechanical issue, often results in lost time and laps. In slot car racing, as in many forms of motorsport, maintaining a clean race is paramount, and any incident that causes a car to de-slot can lead to significant penalties in terms of lost momentum and laps, directly affecting the final results. This incident highlights the fine line between pushing for speed and maintaining control, a challenge every driver faces. Team Jolly Rogers’ Cece Caro also showed her resilience by securing sixth place.

Place Name Laps Points Total Time
1 Steve Stewart 159 58 413.435
2 Andy Gersh 157 46 410.829
3 John Rogers 156 54 410.037
4 Dustin Jolley 156 51 423.245
5 Dean Donaldson 154 42 416.083
6 Cece Caro 145 46 425.714
7 Kevin Webster 126 32 407.319

View Detailed Race Report: RaceReport_ 193_Jul-30-2026_SR3OvalSuperSpeedway.html


New Track Records Set During This Event

A remarkable fourteen new track records were set during this thrilling event, a testament to the drivers’ skill and the intense competition!

Track Class Lane Driver Lap Time Type
Stewart Raceway II Straight Road Course MegaG+ Modified 2026 1 John Rogers 3681 Race
Stewart Raceway II Straight Road Course MegaG+ Modified 2026 2 John Rogers 3498 Race
Stewart Raceway II Straight Road Course MegaG+ Modified 2026 3 John Rogers 3435 Race
Stewart Raceway II Straight Road Course MegaG+ Modified 2026 4 John Rogers 3702 Race
Stewart Raceway II Straight Road Course U-Build Tomahawks (i) Jolly Rogers 1 John Rogers 4398 Race
Stewart Raceway II Straight Road Course U-Build Tomahawks (i) Jolly Rogers 2 Cece Caro 4101 Race
Stewart Raceway II Straight Road Course U-Build Tomahawks (i) Jolly Rogers 3 Dean Donaldson 4321 Race
Stewart Raceway II Straight Road Course U-Build Tomahawks (i) Jolly Rogers 4 Dean Donaldson 4312 Race
SR3 Oval Super Speedway OS3 TFX Lite Paper Midgets 2 Dean Donaldson 3072 Race
SR3 Oval Super Speedway OS3 TFX Lite Paper Midgets 3 John Rogers 3227 Race
SR3 Oval Super Speedway OS3 TFX Lite Paper Midgets 4 John Rogers 3223 Race
SR3 Oval Super Speedway OS3 TFX Lite Paper Midgets 5 Steve Stewart 3185 Race
SR3 Oval Super Speedway Wizzard Storm 22T (i)(o) 16.5v 2 Cece Caro 1639 Race
SR3 Oval Super Speedway Wizzard Storm 22T (i)(o) 16.5v 3 John Rogers 2124 Race
SR3 Oval Super Speedway Wizzard Storm 22T (i)(o) 16.5v 4 Andy Gersh 1900 Race
SR3 Oval Super Speedway Wizzard Storm 22T (i)(o) 16.5v 5 Cece Caro 1790 Race

John Rogers (Team Jolly Rogers) dominated the record books, setting multiple fastest laps across both the new MegaG+ Modified class on Stewart Raceway II and the OS3 TFX Lite Paper Midgets on the SR3 Oval. His teammate Cece Caro also showcased her speed with two new records, including an incredibly fast 1.639-second lap in the Wizzard Storm 22T class on SR3 Oval Lane 2. Dean Donaldson (Full-Speed Racing) contributed significantly with new records in both the U-Build Tomahawks and OS3 TFX Lite Paper Midgets classes. Andy Gersh also etched his name in the record books for the Wizzard Storm 22T class, and Steve Stewart secured a new record in the OS3 TFX Lite Paper Midgets class. These achievements underscore the extraordinary talent and relentless pursuit of speed by all competitors.

Looking Ahead

This Thursday Night “Under The Lights” Round 4 proved to be an exhilarating chapter in the 2026 season. The intensity of competition, especially the captivating duel between Steve Stewart and John Rogers across multiple races, keeps fans on the edge of their seats. The debut of the MegaG+ Modified class on SR2 also promises exciting future developments. Drivers will undoubtedly be back for Round 5, eager to reclaim lost laps and push for victory, with the shadow of John Rogers’ Race 4 incident serving as a stark reminder of the unforgiving nature of championship slot car racing.


Overall Standings After Round 4 Summary

The overall standings reflect a season of intense competition across all divisions. John Rogers leads the Masters after Round 4, a testament to his consistent performance despite the recent track incident. The introduction of the MG+ Modified class is expected to further challenge drivers and elevate the racing experience. Due to the nature of the provided overall standings, detailed lap time analysis to filter potential “rider” laps is not feasible within this report.


Master Division Standings

Place Name Laps Points
1 John Rogers 1576 838
2 Steve Stewart 1544 820
3 Dustin Jolley 1511 738
4 Dean Donaldson 1504 740
5 Cece Caro 1467 670
6 Joe Clarke 920 339
7 Kevin Webster 653 248

Advanced Division Standings

Place Name Laps Points
1 Andy Gersh 757 352

Amateur Division Standings

Place Name Laps Points
1 Tracker Clay 447 119
2 Trakker Clay 148 74
3 Rad Raca 123 68
4 Bobby Graham 118 70

Analysis of John Rogers’ Crash in Race 4, Segment 5

John Rogers’ performance in Race 4 was impacted by a critical incident in Segment 5. The segment length was 40 laps, but John Rogers only completed 39 laps in this segment, placing him 3rd for the segment with 11 points. This suggests a loss of one lap, consistent with a crash or de-slotting event.

Let’s analyze the impact of this lost lap on his final standing:

  • Current Standing: John Rogers finished 3rd overall in Race 4 with 156 total laps and 54 points.
  • Segment 5 Performance: In Segment 5, John Rogers recorded an average lap time of 2.890, while Steve Stewart (1st in segment, 40 laps) had 2.807 and Andy Gersh (2nd in segment, 40 laps) had 2.668. Based on these times, even if Rogers had completed 40 laps, his total segment run time would likely have been slower than Stewart and Gersh, meaning he would still have placed 3rd in the segment and earned 11 points.
  • Hypothetical Scenario (No Lost Lap): If John Rogers had completed the full 40 laps in Segment 5, his total laps for Race 4 would have increased from 156 to 157. His total points would likely remain at 54 (assuming he still earned 11 points for finishing 3rd in that segment).

Impact on Final Position:

  • Original Final Standings (Laps, Points):
    • 1st: Steve Stewart (159 Laps, 58 Points)
    • 2nd: Andy Gersh (157 Laps, 46 Points)
    • 3rd: John Rogers (156 Laps, 54 Points)
    • 4th: Dustin Jolley (156 Laps, 51 Points)
  • Hypothetical Final Standings (with +1 lap for John Rogers):
    • 1st: Steve Stewart (159 Laps, 58 Points)
    • 2nd: John Rogers (157 Laps, 54 Points)
    • 3rd: Andy Gersh (157 Laps, 46 Points)
    • 4th: Dustin Jolley (156 Laps, 51 Points)

Conclusion: The loss of one lap in Segment 5 due to the crash was significant. It caused John Rogers to finish 3rd instead of a potential 2nd place. While he would have been tied on laps with Andy Gersh (157), his superior total points (54 vs. 46) would have placed him higher. This incident highlights how a single misstep can drastically alter race outcomes, especially in tightly contested fields.

I’ll get a video of the incident up on Rumble ASAP.

View Detailed Race Report: RaceReport_ 193_Jul-30-2026_SR3OvalSuperSpeedway.html

⚠️ End of AI‑generated content.

Thursday Night “Under the Lights” Series, Round 4 — Night Moves & Lexan Lightning: The Sportsman Division Steals the Show

Wow! While we typically have a little drama in the Expert ranks, this round of the series was all about the Sportsman division bringing the heat on the Experts. A big thanks to Dean for his superb promotional skills, bringing together another great group of Slotheads for some extremely competitive racing and an absolutely outstanding array of great food and hydration products.

AI-Generated Analysis

The April 23-24 “Under the Lights” event at Stewart Raceway II was a masterclass in trigger control and endurance. The SR3 Road Course (with that treacherous squeeze lane) separated the contenders from the pack, yielding some spectacular battles between the Expert and Sportsman classes.

Short Story

Here is the final breakdown of the April 23–24 “Under the Lights” event, separated into the Sportsman and Expert divisions. This highlights just how intensely the Sportsman drivers challenged the overall standings.

Sportsman Division Summary

The Sportsman division was the true story of the event, with drivers consistently outperforming class expectations and taking the fight directly to the Experts.

  • John Rogers: John led the Sportsman charge, securing an incredible 2nd place overall across the entire field with 378 total laps and 205 points. He captured 5 segment wins across the four races and recorded a blisteringly fast 3.223-second lap in the Viper V-SPEC class. He also laid down the fastest lap of the entire event in the Mustang class (6.797s).

  • Cece Caro: Cece was the ultimate endurance driver, finishing 4th place overall with 360 laps and tying for 3rd in overall points (186). She accomplished the rare feat of winning a segment in every single car class she entered (4 total segment wins) and matched John Rogers’ 3.223-second fast lap in the Viper V-SPECs.

  • Ramsey Wright: Competing in three of the four races, Ramsey captured 6th place overall with 241 laps and 122 points. His strongest showing was in the Mustang class where he broke the 100-lap barrier (104 laps), and he achieved a personal event-best lap of 6.689s in the Lites.

  • Trakker Clay: Trakker also ran a three-race schedule, finishing right behind Ramsey in 7th place overall with 231 laps and 101 points. He successfully secured a segment win in the tricky Mustang class and logged his fastest lap of the night (7.090s) in the Lites.


Expert Division Summary

The Expert drivers had to fight tooth and nail to defend their positions on the leaderboard, especially on the technical SR3 Squeeze Lane track.

  • Dean Donaldson: Dean relied on his veteran consistency to secure 3rd place overall with 362 laps and 186 points, narrowly beating Cece Caro by just two laps for the final podium spot. He picked up 2 segment wins over the course of the event and laid down a 3.298-second fast lap in the Viper V-SPECs.

  • Dustin Jolley: Despite only running the first three races, Dustin was a dominant force, taking 5th place overall with 267 laps and 169 points. He tied for the most non-Stewart segment wins (5 total) and was a constant threat at the top of the heat charts, clocking a 5.776s fast lap in the Lites.

  • Joe Clarke: Joe completed a solid three-race run to finish 8th place overall with 220 laps and 108 points. His best pure speed came in the Lites class, where he recorded a 6.592s fastest lap.

  • Steve Stewart: Steve secured 1st place overall with 395 laps and 239 points. He collected 11 segment wins and the overall fastest lap of the event at 3.211s in the Viper V-SPEC class.

Let’s drop the green flag on the results!

Event Summary: A Sportsman Revolution

The overarching story of this event is the incredible rise of the Sportsman drivers challenging the established Expert hierarchy. While Steve Stewart (Expert) secured the highest overall lap count, the true fireworks happened throughout the rest of the field.

Cece Caro (Sportsman) deserves a massive standing ovation for her phenomenal overall results. She logged a staggering 360 laps across all four grueling races, securing 4th place overall and tying for 3rd in total points. Her ability to stay smooth, keep the car in the slot, and put pressure on the Expert class is a testament to her growing skill.

John Rogers (Sportsman) was an absolute powerhouse, capturing 2nd place overall with 378 laps. Time and time again, John out-paced the Experts, proving that pure speed and consistency can shatter class boundaries.

Dean Donaldson (Expert) utilized his veteran experience to navigate the squeeze lane, banking 362 laps to edge onto the overall podium in 3rd place.

The Sprinters: Partial-Event Highlights

A grueling 4-race schedule isn’t for everyone, but the drivers who joined for the first three legs left a massive impact on the timing sheets:

  • Dustin Jolley (Expert): Dustin was a lethal force in the opening three classes, racking up 267 laps. He finished 2nd in the Midgets and consistently threatened the top of the leaderboard.

  • Ramsey Wright (Sportsman): Ramsey put together a beautiful 241-lap campaign. His performance peaked in the Mustang class with a rock-solid 104 laps.

  • Trakker Clay (Sportsman): Trakker drove a smart, tactical series to claim 231 laps. His consistency in the tricky Mustang class (103 laps) was fantastic.

  • Joe Clarke (Expert): Joe brought the heat for 220 laps, saving his best push for the Mustang class where he broke the 7.3-second barrier.


Detailed Race Analysis

Race 1: MegaG+ 1.7 65 Mustang Ken Miles Team Clarke (i)

The opening race set the tone for the Sportsman uprising. John Rogers (S) tied Expert driver Dustin Jolley at 111 laps, with John laying down an incredibly fast 6.797s lap. Dean Donaldson (E) stayed right in their mirrors with 110 laps. Cece Caro (S) drove a brilliantly clean race to bank 106 laps, easily holding off the rest of the pack.

Pace Summary (Best Segments)

Driver Class Total Laps Fast Lap Best Median Lap
Dustin Jolley Expert 111 6.810 7.372
John Rogers Sportsman 111 6.797 7.400
Dean Donaldson Expert 110 6.896 7.866
Cece Caro Sportsman 106 7.310 8.194
Ramsey Wright Sportsman 104 7.601 9.136
Trakker Clay Sportsman 103 8.119 8.747
Joe Clarke Expert 92 7.242 10.069
Steve Stewart Expert 120 6.834 7.319

Race 2: Mega-G+ 1.7 Lites (Support Class)

The Lites class requires incredible momentum management. Dustin Jolley (E) and John Rogers (S) engaged in another epic duel, deadlocking at 77 laps apiece. Cece Caro (S) was spectacular, falling short of the leaders by just one single lap (76 laps) and putting down a blazing 5.927s fast lap. Dean Donaldson (E) and Trakker Clay (S) rounded out a highly competitive top-mid field.

Pace Summary (Best Segments)

Driver Class Total Laps Fast Lap Best Median Lap
Dustin Jolley Expert 77 5.776 6.364
John Rogers Sportsman 77 5.838 6.163
Cece Caro Sportsman 76 5.927 6.302
Dean Donaldson Expert 71 5.520 6.662
Trakker Clay Sportsman 65 7.090 7.771
Ramsey Wright Sportsman 63 6.689 7.412
Joe Clarke Expert 61 6.592 8.785
Steve Stewart Expert 80 5.511 5.870

Race 3: OS3 TFX Midget Paper (i)

These paper-bodied midgets are notoriously tricky to drive. Dustin Jolley (E) found the sweet spot, pacing the field (aside from Stewart) with 79 laps. John Rogers (S) again showed his versatility, slotting in right behind with 78 laps and the second-fastest lap of the class (9.306s). A brilliant three-way tie emerged mid-pack, with Cece Caro (S), Ramsey Wright (S), and Dean Donaldson (E) all grinding out exactly 74 laps in a true test of nerve.

Pace Summary (Best Segments)

Driver Class Total Laps Fast Lap Best Median Lap
Dustin Jolley Expert 79 9.618 10.480
John Rogers Sportsman 78 9.306 10.500
Cece Caro Sportsman 74 9.545 11.082
Ramsey Wright Sportsman 74 9.857 11.211
Dean Donaldson Expert 74 9.878 10.778
Joe Clarke Expert 67 9.813 12.864
Trakker Clay Sportsman 63 10.514 12.301
Steve Stewart Expert 80 8.817 9.687

Race 4: Viper V-SPEC SPEC STOCK Lexan

With the field narrowed down to four endurance warriors, the Lexan Vipers delivered absolute warp-speed lap times. John Rogers (S) capped off a brilliant event by completing 112 laps, keeping the pressure on the Experts until the final buzzer. Dean Donaldson (E) locked in 107 laps with a blistering 3.298s best lap, while Cece Caro (S) finished her iron-woman run with 104 laps, dipping down into a 3.223s fastest lap—proving her reflexes are sharp enough to run at the absolute limit.

Pace Summary (Best Segments)

Driver Class Total Laps Fast Lap Best Median Lap
John Rogers Sportsman 112 3.223 3.517
Dean Donaldson Expert 107 3.298 3.601
Cece Caro Sportsman 104 3.223 3.449
Steve Stewart Expert 115 3.211

Segment Wins Breakdown

Winning a segment requires absolute focus. Here is a breakdown of the segment victories by driver and car class for the April 23-24 races:

      • John Rogers (Sportsman) – 5 Total Wins: Mustang (1), Lites (1), Midget (2), Viper V-SPEC (1)
      • Dustin Jolley (Expert) – 5 Total Wins: Mustang (1), Lites (2), Midget (2)
      • Cece Caro (Sportsman) – 4 Total Wins: Mustang (1), Lites (1), Midget (1), Viper V-SPEC (1)
      • Dean Donaldson (Expert) – 2 Total Wins: Mustang (1), Lites (1)
      • Trakker Clay (Sportsman) – 1 Total Win: Mustang (1)

Here is the breakdown of the absolute fastest single laps recorded during the April 23–24, 2026 races.

While the Expert class captured three of the four fastest overall laps, the margins highlight just how fiercely the Sportsman drivers were pushing the limits. John Rogers (Sportsman) struck first by claiming the fastest lap in the opening Mustang race. In the final Viper V-SPEC race, Sportsman drivers John Rogers and Cece Caro were only 0.012 seconds behind the absolute fastest time of the night.

Fastest Laps: April 23-24 Event

Car Class Track Fastest Driver Category Lane Lap Time
MegaG+ 1.7 65 Mustang Ken Miles Team Clarke (i) SR3 Road Course Squeeze Lane John Rogers Sportsman Green 6.797s
Mega-G+ 1.7 Lites (Support Class) SR3 Road Course Squeeze Lane Steve Stewart Expert Blue 5.511s
OS3 TFX Midget Paper (i) SR3 Road Course Squeeze Lane Steve Stewart Expert Blue 8.817s
Viper V-SPEC SPEC STOCK Lexan Stewart Raceway II Straight Road Course Steve Stewart Expert Blue 3.211s

Notable Runner-Ups

    • Lites (Support Class): Dean Donaldson (Expert) was a mere 0.009 seconds off the fastest lap, clocking a 5.520s in the White lane.
    • Viper V-SPEC: John Rogers (Sportsman) and Cece Caro (Sportsman) tied for the second-fastest lap at 3.223s, with both drivers achieving this blisteringly fast time in the Yellow lane.

Series Standings after Round 4

The Sportsman drivers continued to show immense dedication, with John Rogers and Cece Caro banking a massive amount of laps and points that rival the top Experts.

Sportsman Division – Final Points Standings

John Rogers took the top honors in the Sportsman division, breaking the 600-point threshold, while Cece Caro secured a highly impressive second place in the class with over 500 points.

Rank Driver Total Points Total Laps
1 John Rogers 606 1201
2 Cece Caro 508 1123
3 Trakker Clay 161 379
4 Ramsey Wright 122 241
5 Jeff Seltzer 94 254
6 Jerry Strebig 72 157
7 Bev Seltzer 67 235
8 Mark Wialbut 65 235

Expert Division – Final Points Standings

In the Expert class, Dustin Jolley managed to edge out Dean Donaldson in total points (737 to 716) despite Dean completing 81 more total laps across the event. Kevin Webster rounded out the Expert field, having competed primarily in the early stages of the event.

Rank Driver Total Points Total Laps
1 Dustin Jolley 737 1401
2 Dean Donaldson 716 1482
3 Joe Clarke 246 567
4 Kevin Webster 125 288
Steve Stewart 860 1566

As always, thank you to all of you participating in this way-cool series and all the swag and goodies you bring to the events to help make this kind of program so successful.

Next Thursday night is out for Kathy and me. Maybe Friday might work, we’ll see. If not, the following Thursday looks doable for us right now. I’ll post a couple of Round 5 Google Calendar options ASAP.

Note: You can skip one race in each series and still be in the points hunt. We take the best four events of each driver to determine the five-event series winner in each division.

Okay, shut up and drive.

Thursday Night “Under The Lights” — High-Speed Battles and Photo Finishes (April 2, 2026)

Mostly AI-generated content

The green flag dropped at Stewart Raceway on April 2, 2026, kicking off a marathon night of slot car racing! With four distinct classes testing our drivers across both the SR3 Road Course (Squeeze Lane) and the Stewart Raceway II Straight Road Course, the night demanded both technical precision and raw, wide-open speed.

After over 2,400 combined laps of intense side-by-side action, here is your definitive race recap.


🏆 Overall Event Standings

Consistency is king in slot car racing, and Steve Stewart proved it by never finishing below second place across all four events, securing the overall victory. Meanwhile, John Rogers and Dean Donaldson fought a dead-heat battle for laps, with Rogers taking the final podium spot entirely on segment points!

Overall Place Driver Total Laps Total Points Total Time (s)
🥇 1st Steve Stewart 416 220 2736.857
🥈 2nd Dustin Jolley 407 210 2672.601
🥉 3rd John Rogers 401 209 2687.603
4th Dean Donaldson 401 192 2693.302
5th Cece Caro 374 159 2715.913
6th Joe Clarke 347 138 2718.592

Closest Head-to-Head Sprint: Race 4, Segment 3

If we look at the closest side-by-side racing within a single heat, the crown goes to Joe Clarke and John Rogers during Segment 3 of the Viper V-SPEC race on the straight road course.

      • Both drivers ran a flawless heat, maxing out the segment cap at 30 laps.

      • Joe Clarke completed his 30 laps in 121.139 seconds.

      • John Rogers completed his 30 laps in 124.364 seconds.

      • The Margin: After 30 blistering laps in the fastest cars of the night, Clarke beat Rogers by a microscopic 3.225 seconds.

If we look for the closest true race—where both drivers ran the exact same number of laps in a heat—the crown goes to John Rogers and Dustin Jolley. They both maxed out the segment cap at 25 laps.

      • John Rogers (Yellow Lane): 161.633 seconds

      • Dustin Jolley (Blue Lane): 161.666 seconds

      • The Gap: 0.033 seconds

      • Context: After 25 laps of side-by-side racing, John Rogers beat Dustin Jolley to the line by just 33 milliseconds. This was the tightest pure racing finish of the entire night.


🏁 Race Breakdowns

Race 1: MegaG+ 1.7 Formula e (i) 18v

Track: SR3 Road Course Squeeze Lane

The night began on the highly technical Squeeze Lane. Surviving the squeeze requires patience, and Steve Stewart capitalized on a steady rhythm to take the inaugural win of the evening. Dean Donaldson threw down the gauntlet with a blistering fastest lap in Segment 6, but Stewart’s volume secured the gold. Details

      • Fastest Lap: Dean Donaldson (5.491s)

      • 1st Place: Steve Stewart (99 Laps | 56 Pts)

      • 2nd Place: Dustin Jolley (98 Laps | 55 Pts)

      • 3rd Place: Dean Donaldson (95 Laps | 54 Pts)

Race 2: Mega-G+ 1.7 Lites (Support Class)

Track: SR3 Road Course Squeeze Lane

The support class delivered the closest finish of the night. Dustin Jolley and Steve Stewart crossed the line with an identical 99 laps. However, Jolley’s aggressive sector times paid off, giving him a massive 61 segment points to take the victory on the tiebreaker!  Details

      • Fastest Lap: Dustin Jolley (5.519s)

      • 1st Place: Dustin Jolley (99 Laps | 61 Pts)

      • 2nd Place: Steve Stewart (99 Laps | 56 Pts)

      • 3rd Place: Dean Donaldson (97 Laps | 53 Pts)

Race 3: Tyco 440-X2 Wide-Pan Porsche 935 Hardbody

Track: Stewart Raceway II Straight Road Course

Transitioning to the SR2 Straight Road Course, the drivers broke out the classic Tyco hardbodies. Dustin Jolley carried his momentum from Race 2 to secure back-to-back victories. Notably, John Rogers fought his way onto the podium here, despite running two laps fewer than Jolley, by racking up a field-leading 56 segment points. Details

      • Fastest Lap: Steve Stewart (5.006s)

      • 1st Place: Dustin Jolley (99 Laps | 50 Pts)

      • 2nd Place: Steve Stewart (98 Laps | 47 Pts)

      • 3rd Place: John Rogers (97 Laps | 56 Pts)

Race 4: Viper V-SPEC SPEC STOCK Lexan

Track: Stewart Raceway II Straight Road Course

The finale was an absolute blur. The Viper V-SPECs delivered the highest speeds and lap counts of the event. Steve Stewart found another gear, putting down a staggering 120 laps to cement his overall event win. But the loudest cheer of the race went to Cece Caro, who unleashed the “Lap of the Night” by ripping a jaw-dropping 3.219-second lap in Segment 6. Details

      • Fastest Lap: Cece Caro (3.219s)

      • 1st Place: Steve Stewart (120 Laps | 61 Pts)

      • 2nd Place: John Rogers (118 Laps | 56 Pts)

      • 3rd Place: Dean Donaldson (115 Laps | 40 Pts)


Driver of the Night: Steve Stewart for a masterful display of consistency, but honorable mention goes to John Rogers for a gritty comeback in the second half of the event to secure an overall podium finish!

⏱️ New Track Records Set!

The April 2nd event wasn’t just about podiums; several new blistering track records were etched into the history books on the SR3 Road Course Squeeze Lane:

      • Mega-G+ 1.7 Lites (Support Class):

        • Dustin Jolley set a new record on Lane 2 with a time of 5.519s.

        • Dustin Jolley set a new record on Lane 3 with a time of 5.524s.

        • Dustin Jolley set a new record on Lane 4 with a time of 5.533s.

        • Dustin Jolley set a new record on Lane 5 with a time of 5.567s.

      • MegaG+ 1.7 Formula e (i) 18v:

        • Dean Donaldson set a new record on Lane 2 with a time of 5.529s.

        • Dean Donaldson set a new record on Lane 3 with a time of 5.636s.

        • Dean Donaldson set a new record on Lane 4 with a time of 5.491s.

        • Dean Donaldson set a new record on Lane 5 with a time of 5.640s.

See you all at the next race! Make sure your shoes are flat, and your tires are clean.


Big thanks to everybody for helping to make the event a huge success. Oh, and a special thanks to Full-Speed Racing and Clarke Racing. Dean brought the delicious beef stew, and Joe brought the awesome chocolate cream pie!

Okay, shut up and drive!

Wednesday Night “Under The Lights” March 11, 2026 — The Bus Stop Strikes Again

Wow! Another blazingly fast and furious night of slot car racing in the Santa Cruz Mountains. This was the fourth “Under The Lights” event of 2026, and we ran on both SR3 and SR2 road courses.

Race and Overall Results Analysis AI-Generated

Short Story

Wednesday Night Under The Lights Event (Four Races on SR2 and SR3 Bus Stop Road Course)The Stewart Raceway’s Wednesday Night Under The Lights event featured four intense races on both the SR2 and SR3 tracks, utilizing the new SR3 Bus Stop road course layout. This challenging configuration emphasizes technical driving, with tighter turns and strategic passing opportunities that test consistency, speed, and car setup. Based on the aggregate data from the four races, the overall standings prioritize total laps completed, reflecting endurance and reliability in a fixed-time or segment-based format typical for slot car events at Stewart Raceway.

Place
Name
Laps
Points
Total Time (seconds)
1
Steve Stewart
427
188
2595.671
2
Joe Clarke
417
201
2562.866
3
Dean Donaldson
415
208
2553.719
4
Kevin Webster
367
134
2576.835
5
Dustin Jolley
233
115
1142.791

This event combined races across SR2 (likely a flatter, more flowing layout) and SR3 (a routed track with potentially faster averages due to smoother surfaces), incorporating the new Bus Stop chicane for added complexity. The Bus Stop section introduces a series of sharp, low-speed turns that reward precise throttle control and penalize over-aggressive driving, often leading to off-track moments or reduced lap counts for less experienced drivers. Total times for the top four drivers hover around 2550-2600 seconds (approximately 42-43 minutes across four races, suggesting each race lasted about 10-11 minutes), indicating a consistent event duration with variable lap completion based on pace and incidents.Key metrics calculated from the data:

    • Average Lap Time (seconds/lap): Total time divided by laps, where lower is better (faster pace).
    • Dustin Jolley: 4.905 (fastest overall, suggesting strong performance in fewer races, possibly on the quicker SR3 layout).
    • Steve Stewart: 6.078
    • Joe Clarke: 6.146
    • Dean Donaldson: 6.153
    • Kevin Webster: 7.019 (slowest, indicating potential setup issues or adaptation challenges on the Bus Stop course).
    • Points Efficiency (points/lap): Points divided by laps, where higher indicates better scoring relative to distance covered (e.g., via podium finishes or bonuses).
    • Dean Donaldson: 0.501 (highest, showing exceptional racecraft and consistency across segments).
    • Dustin Jolley: 0.493
    • Joe Clarke: 0.482
    • Steve Stewart: 0.440
    • Kevin Webster: 0.365 (lowest, possibly due to lower finishes in individual races).

The top three drivers (Steve, Joe, and Dean) demonstrate tight competition, with only 12 laps separating them over four races—equivalent to about 1-2 laps per race. Their similar total times and average lap speeds (around 6.1-6.2 seconds) point to a closely matched field, where small differences in handling the Bus Stop chicane likely decided outcomes. Points tell a different story: Dean’s lead in points (208) despite fewer laps than Steve suggests he dominated individual races or segments, perhaps with multiple wins or high placements on both SR2 and SR3. Joe’s 201 points are impressive for second in laps, indicating reliable top finishes without the raw volume of the leader.

Lower placers faced clearer challenges:

    • Kevin Webster (4th place, 367 laps, 134 points, 2576.835 seconds): Webster’s performance shows resilience in completing a solid lap count but lags in pace (7.019 s/lap average) and efficiency (0.365 pts/lap). This could stem from mechanical tweaks needed for the new Bus Stop layout, which demands optimized traction in low-speed sections. His total time aligns with the leaders, suggesting he avoided major DNFs but struggled with consistency on SR3’s routed surface. With adjustments, Webster could push for podiums in future events, as his endurance highlights potential for multi-race formats.
    • Dustin Jolley (5th place, 233 laps, 115 points, 1142.791 seconds): Jolley’s outing stands out for its speed (blistering 4.905 s/lap average) but limited scope—roughly half the laps and time of the leaders, implying participation in only two races (perhaps focusing on SR3, where faster times are common). His points efficiency (0.493 pts/lap) is near the top, suggesting strong results in those races, like wins or fast laps. If absences were due to scheduling or testing, this bodes well for full events; otherwise, it underscores the Bus Stop course’s unforgiving nature for part-time runs. Jolley’s raw pace makes him a threat in shorter sprints.

Overall, this four-race event with the new Bus Stop road course highlighted the balance between speed, strategy, and reliability at Stewart Raceway. Steve Stewart’s lap dominance secured the win, but Dean Donaldson’s points haul signals a rising star in the Expert class. The event’s multi-track format (SR2 and SR3) added variety, with the Bus Stop chicane likely amplifying differences in driver adaptation. For future races, expect tweaks to car setups (e.g., Viper or MegaG+ classes) to better handle the technical demands.

Race 1: Webster Wizzard Storms (i)

Race 1 Analysis Summary: SR3 Road Course Bus Stop Layout (Wizzard Storms Class) Event Overview: This race on the new Bus Stop layout at Stewart Raceway’s SR3 track (routed for smoother, faster runs) took place on March 11, 2026, starting at 18:42. The Wizzard Storms (i) class featured four drivers in a heat-style format with four segments, each targeting 25 laps. The Bus Stop chicane added technical demands, emphasizing precise braking and acceleration out of tight turns, which amplified differences in car setup and driver adaptation. Scoring awarded points per segment (16 for 1st, 13 for 2nd, 11 for 3rd, 7 for 4th), with total laps as the primary tiebreaker. Steve Stewart emerged victorious with 97 total laps and 47 points, edging out Dean Donaldson (95 laps, 59 points) in a close battle. However, the analysis below emphasizes the lower placings—particularly Kevin Webster’s consistent 4th overall (84 laps, 36 points)—highlighting challenges, improvements, and potential for future races.

Final Standings Table (Aggregated from All Segments):

Place
Name
Total Laps
Total Points
Total Run Time (s)
Avg Lap Time (s)
Fastest Lap (s)
Median Lap Time (s)
1
Steve Stewart
97
47
700.439
7.221
5.340
6.305
2
Dean Donaldson
95
59
687.056
7.232
5.280
6.548
3
Joe Clarke
91
46
693.463
7.620
5.469
6.512
4
Kevin Webster
84
36
701.067
8.346
5.785
7.557

Notes on Aggregates: Average lap times are calculated as total run time divided by total laps (lower is better, indicating faster pace). Fastest and median laps are the best across all segments. Kevin’s higher average (8.346s) reflects adaptation struggles on the Bus Stop, but his fastest lap (5.785s) shows flashes of competitiveness, suggesting setup tweaks could elevate him.

Segment-by-Segment Breakdown:

    • Segment #1 (Blue/Orange/Green/White Lanes): Dean Donaldson dominated from Blue lane with a 7.551s average and 25 laps, setting a strong tone. Joe Clarke followed closely in Orange. Steve Stewart took 3rd with 24 laps, but the focus here is Kevin Webster’s 4th (16 laps, 12.006s average)—his slowest segment, likely due to initial unfamiliarity with the Bus Stop’s low-speed sections, where his median (10.565s) ballooned from poor traction or over-driving turns. This early deficit (9 laps behind the leader) compounded his overall standing, but his fastest lap (7.785s) hinted at potential once dialed in. Total time: ~187-191s across drivers, showing even pacing despite Kevin’s lap shortfall.
    • Segment #2 (Orange/Blue/White/Green Lanes): Lane rotations mixed things up, with Steve Stewart surging to 1st (25 laps, 6.251s average) in Orange. Dean and Kevin tied at 20 laps for 3rd/4th. Emphasizing lower spots: Kevin’s 4th (20 laps, 8.043s average in Green) marked improvement over Segment #1, closing the gap to just 5 laps behind the winner. His median (7.217s) tightened, suggesting better adaptation to the chicane, possibly via throttle adjustments. However, his average remained highest, indicating consistency issues—perhaps voltage or tire grip problems on SR3’s surface. Joe (2nd) and Dean (3rd) pulled ahead cumulatively, but Kevin’s 7 points here kept him in contention. Segment time: ~158-162s, with Kevin’s run time (161.657s) competitive despite fewer laps.
    • Segment #3 (Blue/Green/White/Orange Lanes): Dean reclaimed 1st (25 laps, 6.416s average in Green), with Steve close in 2nd. Joe slipped to 4th (18 laps), but the lower emphasis falls on him and Kevin (3rd, 23 laps in Orange). Kevin’s performance here was his strongest relatively—beating Joe by 5 laps with a 7.357s average and 6.386s median, showing marked progress on the Bus Stop. His fastest (5.785s) rivaled the leaders, suggesting he thrived in Orange lane’s flow. Joe’s 4th (8.564s average in White) was uncharacteristic, possibly from a setup mismatch or off-track incidents inflating his median (6.954s). This segment highlighted lower placers’ variability: Kevin gained ground (now 11 laps behind overall leader), while Joe’s dip (7 points) cost him momentum. Segment time: ~161-169s, with Kevin’s longer run (168.830s) reflecting sustained effort.
    • Segment #4 (White/Orange/Green/Blue Lanes) / Final: Dean won the segment (25 laps, 6.571s average in Orange), but Steve’s overall laps secured the race win. Joe rebounded to 2nd. Focusing on lower: Steve took 4th here (23 laps, 7.834s average in White)—unusual for the winner, perhaps due to fatigue or lane disadvantage, with his median (6.508s) still solid. Kevin’s 3rd (25 laps in Blue) was his best finish, tying the segment high and narrowing his total deficit. His 7.264s average and 6.670s median showed full adaptation, with a 6.144s fastest lap competitive against Dean’s 5.280s. This late surge (11 points) mitigated earlier struggles but couldn’t overcome the cumulative lap gap. Joe’s consistency (25 laps) solidified 3rd overall, while Kevin’s 4th underscored the Bus Stop’s learning curve for him.

Key Insights on Lower Placings:

Kevin Webster’s race epitomized the challenges of the new Bus Stop layout—starting slow (16 laps in Seg. #1) due to high averages (12s+), but progressively improving (20, 23, 25 laps) as he refined his line through the chicane. His overall 8.346s average was 1s+ slower than the top three, pointing to setup opportunities (e.g., gearing for better low-speed torque in Wizzard Storms cars). Flashes of speed (sub-6s laps) suggest he’s podium-capable with practice. Joe Clarke’s brief 4th in Seg. #3 (18 laps) was an outlier, likely incident-related, but didn’t derail his 3rd overall. For lower drivers, lane assignments played a role—Kevin excelled in Orange/Blue (Seg. #3/#4)—while the format rewarded endurance over pure speed. Future races could see Kevin climb with targeted tweaks, making the Bus Stop a equalizer for emerging talent. Details

Race 2: MegaG+ 1.7 Modified Class

The second race of the Wednesday Night Under The Lights event at Stewart Raceway occurred on March 11, 2026, starting at 20:48. Featuring the MegaG+ 1.7 Modified class on the SR3 track with the new Bus Stop layout, this four-segment heat emphasized car modifications for enhanced speed and handling in the chicane’s tight turns. Each segment aimed for 25 laps, with points per segment (16/13/11/7 for 1st-4th). Dean Donaldson and Joe Clarke tied at 98 laps, but Dean’s 52 points edged him to victory via higher segment wins. Steve Stewart (97 laps, 47 points) took 3rd. The analysis below focuses on lower placings, particularly Kevin Webster’s 4th overall (93 laps, 38 points) and segment-specific struggles for others like Steve in early heats, highlighting adaptation to the Bus Stop’s demands in modified cars.
Final Standings Table (Aggregated from All Segments):

Place
Name
Total Laps
Total Points
Total Run Time (s)
Avg Lap Time (s)
Fastest Lap (s)
Median Lap Time (s)
1
Dean Donaldson
98
52
715.334
7.299
5.520
6.240
2
Joe Clarke
98
51
734.261
7.493
5.538
6.676
3
Steve Stewart
97
47
719.710
7.420
5.555
6.033
4
Kevin Webster
93
38
733.972
7.892
6.135
6.939

Notes on Aggregates: Average lap times derived from total run time divided by total laps (lower indicates better pace). Fastest laps are the minimum across segments; medians are approximated as averages of segment medians for overview. Kevin’s higher average (7.892s) and slowest fastest lap (6.135s) underscore setup challenges in the MegaG+ class on the Bus Stop, where modified cars demand precise tuning for low-speed grip.

Segment-by-Segment Breakdown:

    • Segment #1 (White/Green/Blue/Orange Lanes): Dean Donaldson led from White with 25 laps and a 7.789s average. Kevin Webster took a strong 2nd (25 laps), but lower emphasis on Joe Clarke’s 3rd (24 laps, 8.522s average in Blue) and Steve Stewart’s 4th (24 laps, 8.519s average in Orange). Both trailed by just 1 lap, but their higher averages (8.5s+) suggest initial struggles with the Bus Stop chicane—Joe’s median (8.262s) inflated likely from off-tracks, while Steve’s 6.358s median showed inconsistency despite a 5.730s fast lap. This early 4th for Steve (7 points) set a recovery challenge, highlighting Orange lane’s potential disadvantages on SR3. Segment times: ~193-204s, with lower placers’ longer runs reflecting cautious driving.
    • Segment #2 (White/Orange/Green/Blue Lanes): Joe surged to 1st (25 laps in White), with Steve 2nd. Emphasizing lower: Kevin Webster’s 3rd (24 laps, 7.709s average in Orange) and Dean Donaldson’s 4th (24 laps, 7.741s average in Green). Dean’s slip—unusual for the eventual winner—came with a solid 6.341s median but only 24 laps, possibly from setup tweaks mid-race or Green lane issues in the Bus Stop. Kevin’s 3rd was competitive (just 1 lap off), improving his average from Seg. #1, but his 6.898s median indicated lingering grip problems in turns. Both earned 11/7 points here, keeping totals close (Dean at 23, Kevin at 24 overall). Segment times: ~180-185s, showing tighter pacing, though lower placers’ times aligned closely with leaders.
    • Segment #3 (Green/Orange/White/Blue Lanes): Dean won (25 laps in Orange), Joe 2nd. Focus on lower: Steve Stewart’s 3rd (23 laps, 7.479s average in White) and Kevin Webster’s 4th (23 laps, 7.677s average in Blue). Tied in laps but separated by points (11 vs. 7), this segment exposed Bus Stop vulnerabilities—Steve’s 5.840s median was strong, but 2 laps short suggests incidents or power management in modified MegaG+ cars. Kevin’s 6.934s median and 6.135s fastest showed progress, yet his average remained high, pointing to Blue lane challenges or tire wear. Joe’s lead grew, but lower placers stayed within 2 laps, accumulating points (Steve to 31, Kevin to 31). Segment times: ~169-176s, with Kevin’s 175.840s reflecting sustained but slower effort.
    • Segment #4 (Blue/Orange/Green/White Lanes) / Final: Steve won the segment (25 laps in Green), Dean 2nd. Emphasizing lower: Joe Clarke’s 3rd (24 laps, 7.208s average in Orange) and Kevin Webster’s 4th (21 laps, 7.935s average in White). Joe’s 3rd—despite tying Dean’s total laps overall—stemmed from a 6.234s median but 1 lap shy, possibly fatigue or minor errors in the chicane. Kevin’s weakest segment (4 laps behind, highest 7.935s average) capped his race, with a 6.958s median suggesting White lane disadvantages or setup fatigue in the modified class. His 7 points here finalized 4th overall, but the 21 laps highlighted the Bus Stop’s toll on consistency. Segment times: ~165-176s, with lower placers’ longer runs (175s+) indicating endurance over speed.

Key Insights on Lower Placings: Kevin Webster’s consistent 4th overall reflected the MegaG+ 1.7 Modified class’s demands on the Bus Stop layout—strong starts (2nd in Seg. #1) faded to deficits (21 laps in finale), with averages ~0.5-1s slower than leaders due to medians in the 6.9s range, likely from grip or gearing issues in tight turns. Flashes like his 6.135s fastest suggest potential; tweaks could push him higher. Steve Stewart’s early 4th and mid-race 3rd showed recovery but cost points (47 total), emphasizing lane rotation impacts. Joe’s brief 3rd in the final prevented a win despite a lap tie, underscoring segment volatility. Lower drivers demonstrated resilience, with the Bus Stop equalizing the field in modified cars—future events may favor those mastering chicane setups. Details

Race 3: PR-5 GT F1 Hardbody (i)

The third race of the Wednesday Night Under The Lights event at Stewart Raceway took place on March 11, 2026, on the SR2 track with the new Bus Stop layout. This class featured MegaG+ 1.7 Lites cars, known for their balanced performance on road courses, with the Bus Stop chicane adding strategic depth through its series of tight turns that favor smooth driving and setup optimization. The race used a multi-segment heat format with five segments, each targeting 30 laps, and lane rotations (Yellow, Blue, White, Red) with one driver sitting out per segment to accommodate five participants. Dustin Jolley won with 120 laps and 58 points, but the analysis below focuses on the lower placings—Dean Donaldson (3rd, 110 laps, 47 points), Joe Clarke (4th, 114 laps, 42 points), and Kevin Webster (5th, 93 laps, 32 points)—highlighting their challenges, improvements, and areas for growth on the Bus Stop configuration.

Final Standings Table (Aggregated from All Segments):

Place
Name
Total Laps
Total Points
Total Run Time (s)
Avg Lap Time (s)
Fastest Lap (s)
Median Lap Time (s)
1
Dustin Jolley
120
58
608.263
5.069
4.044
~4.8
2
Steve Stewart
117
56
610.393
5.217
4.055
~4.9
3
Dean Donaldson
110
47
620.527
5.641
~5.0
~5.2
4
Joe Clarke
114
42
658.058
5.772
4.092
~5.4
5
Kevin Webster
93
32
628.190
6.754
~6.0
~6.5

Notes on Aggregates: Average lap times calculated as total run time divided by total laps (lower is better).  The faster paces (4-6s/lap) compared to Races 1-2 reflect SR2’s layout, potentially with less elevation or smoother surfaces, though the Bus Stop still penalized inconsistencies.

Segment-by-Segment Breakdown (Summarized from available data; full per-lane metrics limited):

    • Segment #1 (Joe Clarke out): Dustin Jolley dominated on Yellow with 30 laps (16 points, 4.595s average). Steve Stewart 2nd. Focusing on lower: Dean Donaldson and Kevin Webster trailed with fewer laps (exact counts not specified, but behind the top two), likely struggling with initial Bus Stop adaptation in their lanes. Kevin’s higher overall average suggests this segment highlighted his setup issues, possibly tire grip or gearing for the chicane, resulting in slower medians and a lap deficit that set a tough tone for his race.
    • Segment #2 (Dustin Jolley out): Steve Stewart won on Yellow (30 laps, 16 points). Dean 2nd (lap count not specified, but strong). Emphasizing lower: Kevin Webster and Joe Clarke both completed 27 laps (3rd and 4th), earning 11 and 7 points respectively. Joe’s sit-out in Seg. #1 meant he started from behind, and his 27 laps here showed a solid rebound but highlighted pacing issues on the Bus Stop, with averages potentially inflated by turns. Kevin’s consistent but mid-pack finish indicated ongoing challenges, perhaps lane-specific (e.g., Blue or White disadvantages), contributing to his lower efficiency.
    • Segment #3 (Steve Stewart out): Dean Donaldson won on Yellow (30 laps, 16 points). Dustin 2nd on Red. Focus on lower: Joe Clarke 3rd (lap count not specified, 11 points); Kevin Webster 4th with 18 laps in Blue (7 points). Kevin’s low lap count—12 behind the winner—was his weakest, possibly from off-tracks or mechanical hiccups in the Bus Stop’s tight sections, inflating his average to near 9s in some reports. Joe’s 3rd was respectable but reflected variability, as his fastest lap (4.092s) showed potential not fully realized due to consistency lapses.
    • Segment #4 (Dean Donaldson out): Dustin Jolley won on White (30 laps, 16 points). Joe 2nd with 29 laps (13 points). Emphasizing lower: Steve 3rd and Kevin Webster 4th with fewer completions (exact laps not specified, 11 and 7 points). Kevin’s continued lower placement underscored the Bus Stop’s demands on endurance, with his slower averages (up to 9.088s in similar segments) pointing to adaptation struggles or car tuning needs. Joe’s strong 2nd here boosted his total but couldn’t overcome earlier gaps, suggesting fatigue or lane rotation impacts.
    • Segment #5 (Kevin Webster out): Steve Stewart won on White (30 laps, 16 points). Dustin 2nd. Focus on lower: Joe Clarke 3rd with 28 laps (11 points); Dean Donaldson 4th with 23 laps (7 points). Dean’s slip to 4th—his lowest—was notable for the points leader in prior races, with only 23 laps indicating possible incidents or setup mismatch in the Bus Stop chicane during his lane. Joe’s 3rd was consistent but not enough for podium, while Kevin’s sit-out allowed recovery time but left him with the event’s lowest laps, emphasizing his overall challenges.

Key Insights on Lower Placings: Dean Donaldson’s 3rd overall (110 laps, 47 points) was a step back from his Race 2 win, with his 5.641s average reflecting inconsistency on the Bus Stop—strong in Seg. #3 (win) but weak in #5 (23 laps), possibly from lane disadvantages or minor errors in turns. His points efficiency (0.427 pts/lap) was solid, but fewer laps than expected suggest room for better reliability in multi-segment formats. Joe Clarke’s 4th (114 laps, 42 points) showed resilience, with a competitive 4.092s fastest lap, but higher average (5.772s) and variable placements (3rd/4th in most) indicate Bus Stop pacing issues, perhaps over-driving the chicane leading to time losses. His longer total time (658s) despite more laps than Dean points to endurance strengths but efficiency opportunities. Kevin Webster’s 5th (93 laps, 32 points) epitomized the lower field struggles, with the highest average (6.754s) and lowest laps due to poor segments like #3 (18 laps), likely from setup mismatches or learning the new Bus Stop layout. Flashes of competitiveness (e.g., 27 laps in #2) hint at potential, but his 0.344 pts/lap efficiency underscores needs for tweaks in grip or strategy to climb in future SR2 events.

Overall, the lower drivers demonstrated flashes of speed but were hampered by the Bus Stop’s technical nature, making it a key factor in their placements—future races could see gains with focused practice. Details

Race 4: Viper V-SPEC SPEC STOCK Lexan

The final race of the Wednesday Night Under The Lights event at Stewart Raceway wrapped up on March 11, 2026, starting at 22:46 on the SR2 Straight Road Course. This layout, contrasting the Bus Stop chicanes of prior races, features longer straights and flowing sections that reward raw speed and stable setups in the Viper V-SPEC SPEC STOCK Lexan class, with minimal modifications emphasizing stock performance. The five-segment heat format targeted 30 laps per segment, with lane rotations (Blue, Yellow, White, Red) and one driver sitting out each time to manage the five-participant field. Points per segment (16/13/11/7 for 1st-4th) favored consistency, leading to Joe Clarke’s win (119 laps, 56 points) in a tiebreaker over Steve Stewart (119 laps, 50 points). Dustin Jolley took 3rd (117 laps, 56 points).
The analysis below emphasizes lower placings—Dean Donaldson (4th, 109 laps, 45 points) and Kevin Webster (5th, 94 laps, 28 points)—detailing their struggles, progress, and opportunities on this faster, less technical course.

Final Standings Table (Aggregated from All Segments):

Place
Name
Total Laps
Total Points
Total Run Time (s)
Avg Lap Time (s)
Fastest Lap (s)
Median Lap Time (s)
1
Joe Clarke
119
56
533.648
4.484
3.195
3.542
2
Steve Stewart
119
50
548.073
4.606
3.172
3.655
3
Dustin Jolley
117
56
541.774
4.630
3.226
3.597
4
Dean Donaldson
109
45
551.810
5.062
3.296
3.964
5
Kevin Webster
94
28
524.270
5.577
3.540
4.566

Notes on Aggregates: Average lap times from total run time divided by total laps (lower is faster). Fastest laps are the minimum across segments; medians are averages of reported segment medians. The straight course enabled sub-4s laps, but lower drivers’ higher averages (5s+) indicate setup or consistency issues, with sit-outs adding variability.

Segment-by-Segment Breakdown:

    • Segment #1 (Steve Stewart out; Blue/Yellow/White/Red Lanes): Joe Clarke won from Blue (30 laps, 4.084s average). Dustin Jolley 2nd. Emphasizing lower: Dean Donaldson’s 3rd (28 laps, 4.462s average in White) and Kevin Webster’s 4th (21 laps, 5.765s average in Red). Dean trailed by 2 laps with a solid 3.750s median but higher average, suggesting early throttle control issues on straights. Kevin’s 9-lap deficit and 4.759s median highlighted his weakest start, possibly from Red lane disadvantages or stock setup mismatches, inflating time despite a competitive 4.391s fastest. Both earned 11/7 points, but sit-out for Steve kept totals low initially. Segment times: ~127-129s.
    • Segment #2 (Dustin Jolley out; Yellow/Blue/White/Red Lanes): Joe again won (30 laps in Yellow). Steve 2nd on debut. Focus on lower: Dean Donaldson’s 3rd (27 laps, 4.733s average in Blue) and Kevin Webster’s 4th (21 laps, 5.955s average in White). Dean’s 3 laps short of the winner showed improvement but consistency lapses (3.580s median), perhaps from over-pushing on straights. Kevin repeated his low output (21 laps), with a 5.111s median indicating grip or power delivery problems, though his 3.868s fastest rivaled leaders—hinting at potential stifled by errors. Dustin’s sit-out leveled the field temporarily, but lower placers’ 11/7 points kept them trailing (Dean at 22, Kevin at 14). Segment times: ~128-132s.
    • Segment #3 (Joe Clarke out; Yellow/Blue/White/Red Lanes): Dean Donaldson won his only segment (30 laps, 4.460s average in Yellow). Steve 2nd. Emphasizing lower: Dustin Jolley’s 3rd (28 laps, 4.804s average in Red) and Kevin Webster’s 4th (28 laps, 4.823s average in Blue). Dustin’s slip—despite a 3.843s median—came 2 laps short, possibly from Red lane challenges or minor incidents, costing momentum with 11 points. Kevin’s best relative finish (tied laps with Dustin) marked progress, tightening his average and 4.137s median, suggesting adaptation to the straight course’s speed—though still 7 points here, his total reached 21. Joe’s sit-out allowed lower drivers to close gaps temporarily. Segment times: ~138-142s.
    • Segment #4 (Dean Donaldson out; Yellow/Red/Blue/White Lanes): Dustin Jolley won (30 laps in White). Steve 2nd. Focus on lower: Joe Clarke’s 3rd (29 laps, 4.222s average in Red) and Kevin Webster’s 4th (24 laps, 5.111s average in Yellow). Joe’s near-miss (1 lap off) with a 3.700s median was solid but uncharacteristic for the leader, perhaps Red lane or fatigue-related, earning 11 points to maintain his edge. Kevin’s 6-lap deficit reverted to early form, with a 4.258s median inflated by possible off-tracks on straights, adding just 7 points (total 28). Dean’s sit-out preserved his laps but halted his surge. Segment times: ~124-127s.
    • Segment #5 (Kevin Webster out; White/Yellow/Blue/Red Lanes) / Final: Dustin won the segment (30 laps in Blue). Joe 2nd. Emphasizing lower: Steve Stewart’s 3rd (30 laps, 4.873s average in Yellow) and Dean Donaldson’s 4th (24 laps, 6.048s average in Red). Steve’s 3rd—completing full laps but with an elevated 3.810s median—secured 11 points, but couldn’t overtake Joe’s total despite lap tie. Dean’s weakest (6 laps short, highest 6.048s average) capped his race, with a 4.803s median suggesting Red lane struggles or setup fatigue, yielding 7 points (total 45). Kevin’s sit-out finalized his low laps, underscoring endurance limits.

Key Insights on Lower Placings:

Dean Donaldson’s 4th (109 laps, 45 points) reflected inconsistency on the straight course—strong in Seg. #3 (win) but faltering in #5 (24 laps), with a 5.062s average ~0.5s slower than podium due to medians around 4s, likely from pushing limits without full stability in stock Lexan bodies. His 0.413 pts/lap efficiency was decent, but sit-outs and variability suggest better rotation management could elevate him.
Kevin Webster’s 5th (94 laps, 28 points) epitomized lower-field challenges, with the highest average (5.577s) and frequent low outputs (21-24 laps in active segments), pointing to setup tweaks needed for straights—though improved in #3 (28 laps), his 0.298 pts/lap highlights adaptation issues. Dustin Jolley’s 3rd (117 laps, 56 points), while podium, shared lower traits like Seg. #3’s 3rd, with a 4.630s average showing reliability but occasional deficits. The straight layout amplified speed gaps for lower drivers, but their sub-4s fastest laps indicate potential; future events may favor them with refined tuning. Details

Series Standings 2026 “Under The Lights”

Place Name Laps Points Total Time
Junior Division
1 Austin Brentmar 204 100 2060.362
2 Rye Jolley 187 68 2147.751
Sportsman Division
4 Joe Clarke 1324 572 9902.457
5 Jeff Seltzer 337 160 3206.600
6 Wayne Locke 341 136 2019.909
8 Bev Seltzer 310 129 3090.575
10 Mike Langell 262 98 3506.202
11 Ramsey Wright 202 85 2005.230
13 Max Dunn 103 49 999.582
14 Tara DelaGarza 89 38 1002.428
15 Mark Wialbut 98 35 1058.522
17 Phil Rogers 71 28 710.348
Expert Division
1 Steve Stewart 2171 1202 17086.699
2 Dean Donaldson 2070 1037 17340.921
3 Dustin Jolley 1966 1000 15711.202
7 Kevin Webster 367 134 2576.835

Team Clarke’s, Joe Clarke, leads the Sportsman division points and is likely our next Expert division addition. After four “Under The Lights” events, Joe is well ahead of his nearest rival, Seltzer Racing’s Jeff Seltzer. With one more event to complete, Joe is quite likely to get the nod to the Expert ranks very soon.