⚠️ This report was primarily generated by an AI model.
Thursday Night Under The Lights, Round 5 Finale!
Event Date: June 25, 2026
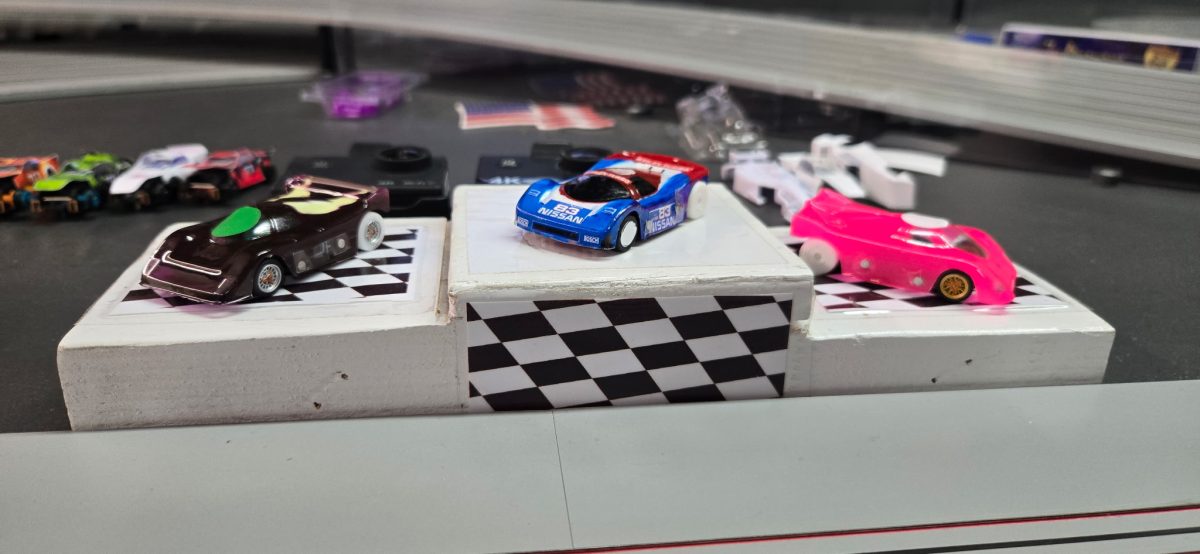
In a night that epitomized the thrilling unpredictability of slot car racing, Stewart Raceway’s SR3 Road Course Squeeze Lane delivered another unforgettable “Thursday Night Under The Lights” session, Round 5. The air crackled with anticipation as drivers navigated the challenging circuit, renowned for its tight turns and strategic fuel management, a hallmark often celebrated in the race recaps on stewartraceway.org. This evening was characterized by exceptionally close battles across multiple classes, keeping spectators on the edge of their seats until the very last lap. A standout narrative of the night was the meteoric rise of Advanced driver Cece Caro, whose consistent top-tier performances strongly suggest her imminent ascension to the Master division. Adding to the excitement, new driver Andy Gersh demonstrated an impressive knack for adapting quickly to the unique demands of the SR3 squeeze lane and fuel-intensive racing, showcasing the talent pipeline thriving at Stewart Raceway.
Race Summaries and Analysis
Race 1: MegaG+ 1.7 Formula e (i) 18v
The MegaG+ Formula e class kicked off the evening with a fiercely contested race on the SR3 Road Course. After a series of intense segments, Master driver Dean Donaldson emerged victorious, showcasing exceptional consistency on the challenging Squeeze Lane. The top of the leaderboard was incredibly tight, with four Master drivers separated by mere laps.
Race 1 Results: MegaG+ 1.7 Formula e (i) 18v
| Race Place | Driver | Total Laps | Total Points | Class |
|---|---|---|---|---|
| 1 | Dean Donaldson | 78 | 61 | Master |
| 2 | Steve Stewart | 78 | 56 | Master |
| 3 | Dustin Jolley | 75 | 55 | Master |
| 4 | John Rogers | 78 | 52 | Master |
| 5 | Joe Clarke | 69 | 44 | Master |
| 6 | Cece Caro | 72 | 40 | Advanced |
| 7 | Andy Gersh | 68 | 40 | Advanced |
| 8 | Ramsey Wright | 63 | 28 | Advanced |
View Detailed Race Report: RaceReport_ 161_Jun-25-2026_SR3RoadCourseSqueezeLane.html
Highlights:
- Dean Donaldson’s Triumph: Master driver Dean Donaldson clinched a hard-fought victory, demonstrating superb control and strategic driving.
- A Photo Finish: The race for the top spots was exceptionally close, with Dean Donaldson, Steve Stewart, and John Rogers all completing 78 laps, highlighting the precision required on the SR3.
- Advanced Drivers Impress: Advanced drivers Cece Caro and Andy Gersh both notched up 40 total points, showcasing their increasing proficiency on this demanding track. Andy Gersh, in particular, continues to rapidly adapt to the intricacies of the SR3 Road Course Squeeze Lane.
Race 2: Viper-Jet NAStruck Lexan (i)
The Viper-Jet NAStruck Lexan race proved to be another high-speed affair, with drivers pushing their cars to the limit. The competition remained incredibly tight, particularly among the Master division.
Race 2 Results: Viper-Jet NAStruck Lexan (i)
| Race Place | Driver | Total Laps | Total Points | Class |
|---|---|---|---|---|
| 1 | Steve Stewart | 80 | 61 | Master |
| 2 | Dustin Jolley | 77 | 56 | Master |
| 3 | John Rogers | 78 | 53 | Master |
| 4 | Dean Donaldson | 78 | 53 | Master |
| 5 | Cece Caro | 75 | 51 | Advanced |
| 6 | Andy Gersh | 74 | 46 | Advanced |
| 7 | Joe Clarke | 68 | 28 | Master |
| 8 | Ramsey Wright | 67 | 28 | Advanced |
View Detailed Race Report: RaceReport_ 163_Jun-25-2026_SR3RoadCourseSqueezeLane.html
Highlights:
- Cece Caro’s Stellar Performance: Advanced driver Cece Caro once again demonstrated her formidable talent, securing 5th place and narrowly missing a podium finish against a field of seasoned Master drivers. Her 75 laps were just three shy of the joint 3rd place Masters, underscoring her readiness for the next division.
- Consistent Showing for Gersh: New Advanced driver Andy Gersh continued his strong adaptation, securing 6th place with 74 laps, keeping pace with more experienced competitors.
- Tight Master Battles: Dustin Jolley, John Rogers, and Dean Donaldson engaged in a thrilling contest for the secondary podium spots, with John and Dean tying on total laps.
Race 3: Mega G+ 1.7 Corvette C8 (i)
The Mega G+ Corvette C8 class brought more intense competition. This race was particularly noteworthy for the exceptional performance of the Advanced drivers, who truly pushed the boundaries of their division.
Race 3 Results: Mega G+ 1.7 Corvette C8 (i)
| Race Place | Driver | Total Laps | Total Points | Class |
|---|---|---|---|---|
| 1 | Dustin Jolley | 79 | 55 | Master |
| 2 | Dean Donaldson | 77 | 53 | Master |
| 3 | John Rogers | 78 | 52 | Master |
| 4 | Cece Caro | 78 | 51 | Advanced |
| 5 | Steve Stewart | 77 | 50 | Master |
| 6 | Joe Clarke | 71 | 41 | Master |
| 7 | Andy Gersh | 72 | 38 | Advanced |
| 8 | Ramsey Wright | 67 | 36 | Advanced |
View Detailed Race Report: RaceReport_ 165_Jun-25-2026_SR3RoadCourseSqueezeLane.html
Highlights:
- Cece Caro’s Breakthrough: In a truly remarkable performance, Advanced driver Cece Caro finished 4th, matching Master driver John Rogers’s total laps (78) and securing 51 points, just two points behind 2nd place. This incredible drive further solidifies her status as a top contender and makes her ascent to the Master division all but certain. This achievement is a highlight for lone advanced drivers.
- Dustin Jolley’s Victory: Master driver Dustin Jolley secured a convincing win, navigating the Corvette C8 with precision.
- Gersh’s Steadfast Performance: Andy Gersh continued his consistent run, finishing 7th with 72 laps, underscoring his quick proficiency on the track.
- Ramsey Wright’s Endurance: Advanced driver Ramsey Wright completed 67 laps, showcasing endurance and determination in a competitive field.
Race 4: OS3 TFX (i) Ramsey Set
The final race of the evening, featuring the OS3 TFX Ramsey Set, brought the action to a dramatic close. This class often demands a different driving style, testing versatility and car control.
Race 4 Results: OS3 TFX (i) Ramsey Set
| Race Place | Driver | Total Laps | Total Points | Class |
|---|---|---|---|---|
| 1 | John Rogers | 77 | 59 | Master |
| 2 | Steve Stewart | 76 | 56 | Master |
| 3 | Dustin Jolley | 73 | 53 | Master |
| 4 | Dean Donaldson | 73 | 48 | Master |
| 5 | Cece Caro | 69 | 38 | Advanced |
| 6 | Ramsey Wright | 69 | 28 | Advanced |
View Detailed Race Report: RaceReport_ 166_Jun-25-2026_SR3RoadCourseSqueezeLane.html
Highlights:
- John Rogers Dominates: Master driver John Rogers took a commanding victory in the OS3 TFX class, demonstrating his adaptability across different car types.
- Advanced Drivers Side-by-Side: Cece Caro and Ramsey Wright, both Advanced drivers, concluded the race with an identical 69 laps, emphasizing their competitive drive and skill even in a less familiar car class. This closely matched performance highlights individual advanced driver achievements.
Conclusion
Thursday Night Under The Lights, Round 5, was a testament to the thriving slot car racing community at Stewart Raceway. The consistently tight finishes and the remarkable performances from both seasoned Masters and ascending Advanced drivers like Cece Caro and Andy Gersh made for a memorable night. As the season progresses, all eyes will be on Cece Caro’s continued journey, anticipating her official entry into the Master division, while Andy Gersh’s rapid development promises more exciting races to come. These events continue to uphold the vibrant, competitive spirit that Stewart Raceway is known for.
⚠️ End of AI‑generated content.
⚠️ This report was primarily generated by an AI model.
“Thursday Night Under The Lights, Round 5: Close Quarters Racing and a Stellar Performance Propel Cece Caro Towards Master Division Stardom! (June 26, 2026)”
Another electrifying night of slot car racing unfolded at Stewart Raceway for Round 5, delivering thrilling competition across all divisions. The SR3 track, with its infamous squeeze lane and demanding fuel racing, pushed every driver to their limits, resulting in some incredibly tight finishes and significant shifts in the overall points standings. While the track owner continued his strong run, the spotlight truly shone on the fierce battles brewing just behind him, particularly with the stellar ascent of Cece Caro.
Points Standings by Driver Division
Here are the summarized points standings after a gripping Round 5:
Master Division Standings
| Place | Driver | Laps | Points |
|---|---|---|---|
| 1 | Dustin Jolley | 1487 | 901 |
| 2 | John Rogers | 1442 | 844 |
| 3 | Dean Donaldson | 1398 | 842 |
| 4 | Joe Clarke | 383 | 201 |
| 5 | Kevin Webster | 330 | 175 |
| * | Steve Stewart | 1536 | 996 |
| Note: Steve Stewart’s results are presented for record-keeping purposes as the track owner. Competition for championship points in the Master Division remains fiercely contested among the other top drivers. | |||
Advanced Division Standings
| Place | Driver | Laps | Points |
|---|---|---|---|
| 1 | Cece Caro | 1391 | 748 |
| 2 | Max Dunn | 332 | 180 |
| 3 | Andy Gersh | 214 | 124 |
| 4 | Ramsey Wright | 266 | 120 |
| 5 | Jeff Seltzer | 204 | 112 |
Amateur Division Standings
| Place | Driver | Laps | Points |
|---|---|---|---|
| 1 | Trakker Clay | 441 | 230 |
| 2 | Rip Rippen | 14 | 17 |
Key Insights and Statistics:
- Cece Caro’s Breakthrough Performance: Cece Caro delivered an astonishing performance, securing the top spot in the Advanced Division with an impressive 748 points. Her lap count of 1391 was remarkably close to the Master Division front-runners, marking her as a significant talent. This outstanding showing clearly signals her readiness for the Master division, and we anticipate her formal ascension soon, making her a formidable contender among the sport’s elite.
- Andy Gersh: A Rising Star: Newcomer Andy Gersh quickly demonstrated his prowess, adapting seamlessly to the challenging SR3 track. His 124 points and 214 laps are a testament to his rapid learning curve, especially concerning the SR3’s notoriously tricky squeeze lane and strategic fuel management. Andy’s performance suggests he will be a driver to watch in future rounds.
- Amateur Division Highlights: Trakker Clay showcased strong, consistent racing, leading the Amateur division with 230 points over 441 laps. His dedication and skill continue to impress, demonstrating the depth of talent emerging from the Amateur ranks. Rip Rippen also made an appearance, garnering 17 points, indicating a desire to join the competitive fray and hone his skills.
- Close Battles in Master Division: Beyond the overall leader, the Master Division saw extremely tight competition. Dustin Jolley (901 points) maintained a solid lead, but John Rogers (844 points) and Dean Donaldson (842 points) are locked in a battle for the podium, separated by just two points! This intense rivalry promises an exciting conclusion to the 2026 season.
Historical Context from Stewart Raceway:
Stewart Raceway, a cornerstone of the slot car racing community, has always prided itself on fostering both fierce competition and a welcoming environment for drivers of all skill levels. The challenging SR3 track, with its unique layout featuring the “squeeze lane” and sophisticated fuel racing mechanics, is designed to test not just speed, but also strategy and driver discipline. This philosophy, rooted in years of racing tradition documented on stewartraceway.org, ensures that natural talent and dedicated practice are rewarded. The tiered division structure (Junior, Amateur, Advanced, Master) serves as a clear progression path, allowing drivers like Cece Caro to steadily advance based on consistent, high-level performance, creating new rivalries and pushing the limits of the sport.
⚠️ End of AI‑generated content.
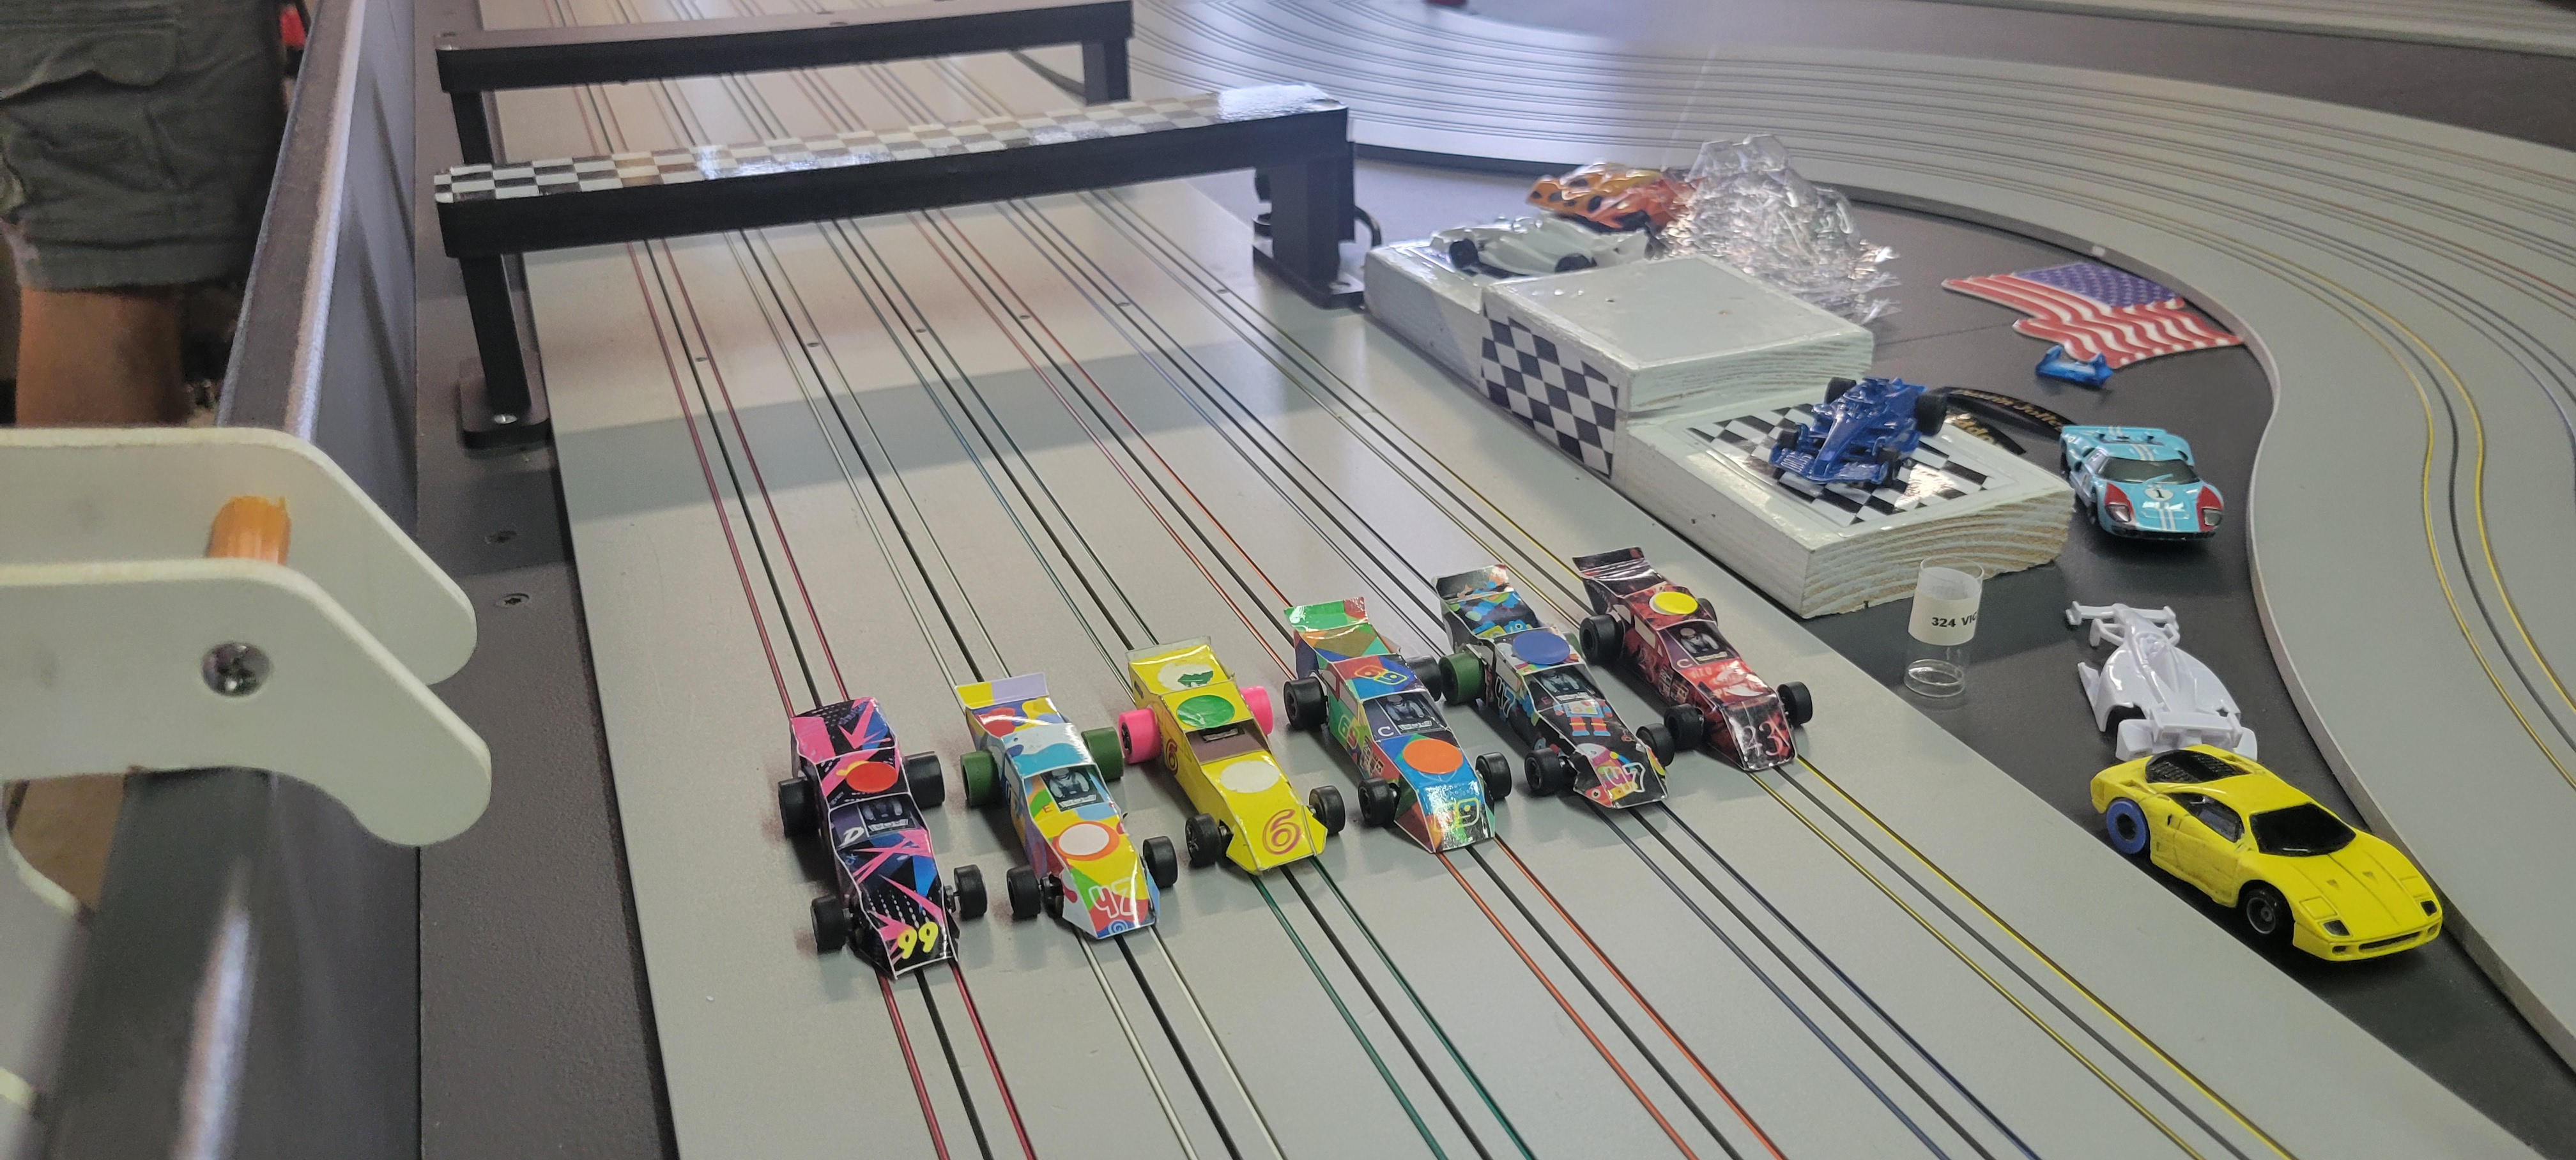
Okay, next up, possibly next Thursday, but could be a Saturday, is our annual IROC Challenge. Six IROC races determine our 2026 season IROC champs in each division. Stay tuned for details.
Again, a big thanks from the Stewart Raceway for participating and making this Thursday Night Series so fun and successful. Oh, and don’t forget to work on your MegaG+ 1.7 Modified platforms. We’re going to start running that class soon.
Okay, shut up and drive!

 This mod gives you a significant performance boost and lets you run any Viper Narrow PST Slip-On tire set.
 Brass, Delrin, or Alloy hubs are allowed.
 This is a motor and electronics board available from either Jag Hobbies or Viper. Viper also makes their own replacement motor assembly, which should be available on their site soon.