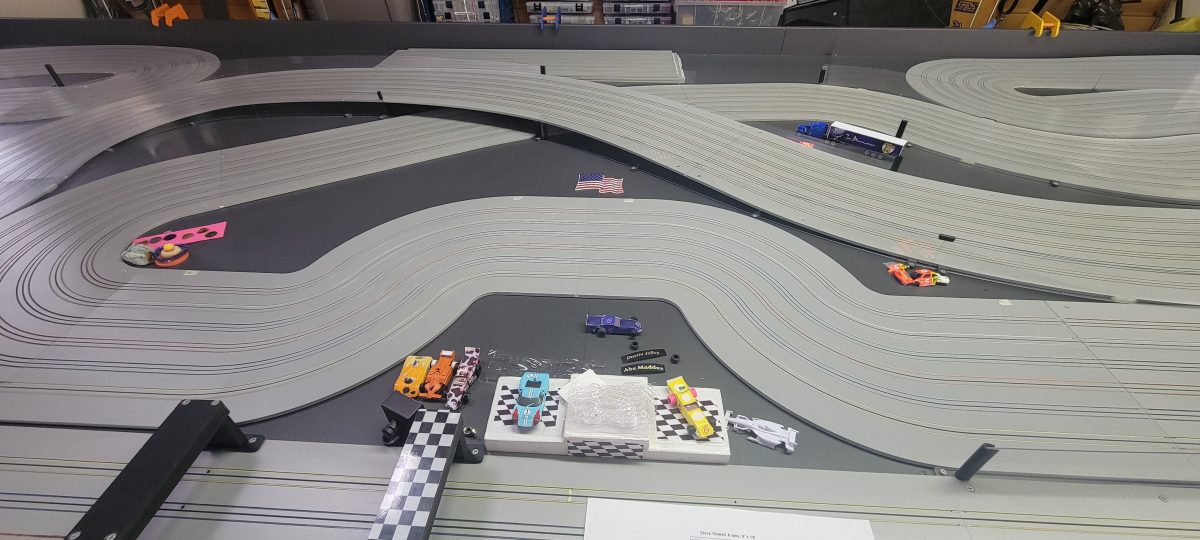
Wow! Another blazingly fast and furious night of slot car racing in the Santa Cruz Mountains. This was the fourth “Under The Lights” event of 2026, and we ran on both SR3 and SR2 road courses.
Race and Overall Results Analysis AI-Generated
Short Story
Wednesday Night Under The Lights Event (Four Races on SR2 and SR3 Bus Stop Road Course)The Stewart Raceway’s Wednesday Night Under The Lights event featured four intense races on both the SR2 and SR3 tracks, utilizing the new SR3 Bus Stop road course layout. This challenging configuration emphasizes technical driving, with tighter turns and strategic passing opportunities that test consistency, speed, and car setup. Based on the aggregate data from the four races, the overall standings prioritize total laps completed, reflecting endurance and reliability in a fixed-time or segment-based format typical for slot car events at Stewart Raceway.
|
Place
|
Name
|
Laps
|
Points
|
Total Time (seconds)
|
|---|---|---|---|---|
|
1
|
Steve Stewart
|
427
|
188
|
2595.671
|
|
2
|
Joe Clarke
|
417
|
201
|
2562.866
|
|
3
|
Dean Donaldson
|
415
|
208
|
2553.719
|
|
4
|
Kevin Webster
|
367
|
134
|
2576.835
|
|
5
|
Dustin Jolley
|
233
|
115
|
1142.791
|
This event combined races across SR2 (likely a flatter, more flowing layout) and SR3 (a routed track with potentially faster averages due to smoother surfaces), incorporating the new Bus Stop chicane for added complexity. The Bus Stop section introduces a series of sharp, low-speed turns that reward precise throttle control and penalize over-aggressive driving, often leading to off-track moments or reduced lap counts for less experienced drivers. Total times for the top four drivers hover around 2550-2600 seconds (approximately 42-43 minutes across four races, suggesting each race lasted about 10-11 minutes), indicating a consistent event duration with variable lap completion based on pace and incidents.Key metrics calculated from the data:
-
- Average Lap Time (seconds/lap): Total time divided by laps, where lower is better (faster pace).
- Dustin Jolley: 4.905 (fastest overall, suggesting strong performance in fewer races, possibly on the quicker SR3 layout).
- Steve Stewart: 6.078
- Joe Clarke: 6.146
- Dean Donaldson: 6.153
- Kevin Webster: 7.019 (slowest, indicating potential setup issues or adaptation challenges on the Bus Stop course).
- Points Efficiency (points/lap): Points divided by laps, where higher indicates better scoring relative to distance covered (e.g., via podium finishes or bonuses).
- Dean Donaldson: 0.501 (highest, showing exceptional racecraft and consistency across segments).
- Dustin Jolley: 0.493
- Joe Clarke: 0.482
- Steve Stewart: 0.440
- Kevin Webster: 0.365 (lowest, possibly due to lower finishes in individual races).
The top three drivers (Steve, Joe, and Dean) demonstrate tight competition, with only 12 laps separating them over four races—equivalent to about 1-2 laps per race. Their similar total times and average lap speeds (around 6.1-6.2 seconds) point to a closely matched field, where small differences in handling the Bus Stop chicane likely decided outcomes. Points tell a different story: Dean’s lead in points (208) despite fewer laps than Steve suggests he dominated individual races or segments, perhaps with multiple wins or high placements on both SR2 and SR3. Joe’s 201 points are impressive for second in laps, indicating reliable top finishes without the raw volume of the leader.
Lower placers faced clearer challenges:
-
- Kevin Webster (4th place, 367 laps, 134 points, 2576.835 seconds): Webster’s performance shows resilience in completing a solid lap count but lags in pace (7.019 s/lap average) and efficiency (0.365 pts/lap). This could stem from mechanical tweaks needed for the new Bus Stop layout, which demands optimized traction in low-speed sections. His total time aligns with the leaders, suggesting he avoided major DNFs but struggled with consistency on SR3’s routed surface. With adjustments, Webster could push for podiums in future events, as his endurance highlights potential for multi-race formats.
- Dustin Jolley (5th place, 233 laps, 115 points, 1142.791 seconds): Jolley’s outing stands out for its speed (blistering 4.905 s/lap average) but limited scope—roughly half the laps and time of the leaders, implying participation in only two races (perhaps focusing on SR3, where faster times are common). His points efficiency (0.493 pts/lap) is near the top, suggesting strong results in those races, like wins or fast laps. If absences were due to scheduling or testing, this bodes well for full events; otherwise, it underscores the Bus Stop course’s unforgiving nature for part-time runs. Jolley’s raw pace makes him a threat in shorter sprints.
Overall, this four-race event with the new Bus Stop road course highlighted the balance between speed, strategy, and reliability at Stewart Raceway. Steve Stewart’s lap dominance secured the win, but Dean Donaldson’s points haul signals a rising star in the Expert class. The event’s multi-track format (SR2 and SR3) added variety, with the Bus Stop chicane likely amplifying differences in driver adaptation. For future races, expect tweaks to car setups (e.g., Viper or MegaG+ classes) to better handle the technical demands.
Race 1: Webster Wizzard Storms (i)
Final Standings Table (Aggregated from All Segments):
|
Place
|
Name
|
Total Laps
|
Total Points
|
Total Run Time (s)
|
Avg Lap Time (s)
|
Fastest Lap (s)
|
Median Lap Time (s)
|
|---|---|---|---|---|---|---|---|
|
1
|
Steve Stewart
|
97
|
47
|
700.439
|
7.221
|
5.340
|
6.305
|
|
2
|
Dean Donaldson
|
95
|
59
|
687.056
|
7.232
|
5.280
|
6.548
|
|
3
|
Joe Clarke
|
91
|
46
|
693.463
|
7.620
|
5.469
|
6.512
|
|
4
|
Kevin Webster
|
84
|
36
|
701.067
|
8.346
|
5.785
|
7.557
|
Notes on Aggregates: Average lap times are calculated as total run time divided by total laps (lower is better, indicating faster pace). Fastest and median laps are the best across all segments. Kevin’s higher average (8.346s) reflects adaptation struggles on the Bus Stop, but his fastest lap (5.785s) shows flashes of competitiveness, suggesting setup tweaks could elevate him.
Segment-by-Segment Breakdown:
-
- Segment #1 (Blue/Orange/Green/White Lanes): Dean Donaldson dominated from Blue lane with a 7.551s average and 25 laps, setting a strong tone. Joe Clarke followed closely in Orange. Steve Stewart took 3rd with 24 laps, but the focus here is Kevin Webster’s 4th (16 laps, 12.006s average)—his slowest segment, likely due to initial unfamiliarity with the Bus Stop’s low-speed sections, where his median (10.565s) ballooned from poor traction or over-driving turns. This early deficit (9 laps behind the leader) compounded his overall standing, but his fastest lap (7.785s) hinted at potential once dialed in. Total time: ~187-191s across drivers, showing even pacing despite Kevin’s lap shortfall.
- Segment #2 (Orange/Blue/White/Green Lanes): Lane rotations mixed things up, with Steve Stewart surging to 1st (25 laps, 6.251s average) in Orange. Dean and Kevin tied at 20 laps for 3rd/4th. Emphasizing lower spots: Kevin’s 4th (20 laps, 8.043s average in Green) marked improvement over Segment #1, closing the gap to just 5 laps behind the winner. His median (7.217s) tightened, suggesting better adaptation to the chicane, possibly via throttle adjustments. However, his average remained highest, indicating consistency issues—perhaps voltage or tire grip problems on SR3’s surface. Joe (2nd) and Dean (3rd) pulled ahead cumulatively, but Kevin’s 7 points here kept him in contention. Segment time: ~158-162s, with Kevin’s run time (161.657s) competitive despite fewer laps.
- Segment #3 (Blue/Green/White/Orange Lanes): Dean reclaimed 1st (25 laps, 6.416s average in Green), with Steve close in 2nd. Joe slipped to 4th (18 laps), but the lower emphasis falls on him and Kevin (3rd, 23 laps in Orange). Kevin’s performance here was his strongest relatively—beating Joe by 5 laps with a 7.357s average and 6.386s median, showing marked progress on the Bus Stop. His fastest (5.785s) rivaled the leaders, suggesting he thrived in Orange lane’s flow. Joe’s 4th (8.564s average in White) was uncharacteristic, possibly from a setup mismatch or off-track incidents inflating his median (6.954s). This segment highlighted lower placers’ variability: Kevin gained ground (now 11 laps behind overall leader), while Joe’s dip (7 points) cost him momentum. Segment time: ~161-169s, with Kevin’s longer run (168.830s) reflecting sustained effort.
- Segment #4 (White/Orange/Green/Blue Lanes) / Final: Dean won the segment (25 laps, 6.571s average in Orange), but Steve’s overall laps secured the race win. Joe rebounded to 2nd. Focusing on lower: Steve took 4th here (23 laps, 7.834s average in White)—unusual for the winner, perhaps due to fatigue or lane disadvantage, with his median (6.508s) still solid. Kevin’s 3rd (25 laps in Blue) was his best finish, tying the segment high and narrowing his total deficit. His 7.264s average and 6.670s median showed full adaptation, with a 6.144s fastest lap competitive against Dean’s 5.280s. This late surge (11 points) mitigated earlier struggles but couldn’t overcome the cumulative lap gap. Joe’s consistency (25 laps) solidified 3rd overall, while Kevin’s 4th underscored the Bus Stop’s learning curve for him.
Key Insights on Lower Placings:
Race 2: MegaG+ 1.7 Modified Class
Final Standings Table (Aggregated from All Segments):
|
Place
|
Name
|
Total Laps
|
Total Points
|
Total Run Time (s)
|
Avg Lap Time (s)
|
Fastest Lap (s)
|
Median Lap Time (s)
|
|---|---|---|---|---|---|---|---|
|
1
|
Dean Donaldson
|
98
|
52
|
715.334
|
7.299
|
5.520
|
6.240
|
|
2
|
Joe Clarke
|
98
|
51
|
734.261
|
7.493
|
5.538
|
6.676
|
|
3
|
Steve Stewart
|
97
|
47
|
719.710
|
7.420
|
5.555
|
6.033
|
|
4
|
Kevin Webster
|
93
|
38
|
733.972
|
7.892
|
6.135
|
6.939
|
Notes on Aggregates: Average lap times derived from total run time divided by total laps (lower indicates better pace). Fastest laps are the minimum across segments; medians are approximated as averages of segment medians for overview. Kevin’s higher average (7.892s) and slowest fastest lap (6.135s) underscore setup challenges in the MegaG+ class on the Bus Stop, where modified cars demand precise tuning for low-speed grip.
Segment-by-Segment Breakdown:
-
- Segment #1 (White/Green/Blue/Orange Lanes): Dean Donaldson led from White with 25 laps and a 7.789s average. Kevin Webster took a strong 2nd (25 laps), but lower emphasis on Joe Clarke’s 3rd (24 laps, 8.522s average in Blue) and Steve Stewart’s 4th (24 laps, 8.519s average in Orange). Both trailed by just 1 lap, but their higher averages (8.5s+) suggest initial struggles with the Bus Stop chicane—Joe’s median (8.262s) inflated likely from off-tracks, while Steve’s 6.358s median showed inconsistency despite a 5.730s fast lap. This early 4th for Steve (7 points) set a recovery challenge, highlighting Orange lane’s potential disadvantages on SR3. Segment times: ~193-204s, with lower placers’ longer runs reflecting cautious driving.
- Segment #2 (White/Orange/Green/Blue Lanes): Joe surged to 1st (25 laps in White), with Steve 2nd. Emphasizing lower: Kevin Webster’s 3rd (24 laps, 7.709s average in Orange) and Dean Donaldson’s 4th (24 laps, 7.741s average in Green). Dean’s slip—unusual for the eventual winner—came with a solid 6.341s median but only 24 laps, possibly from setup tweaks mid-race or Green lane issues in the Bus Stop. Kevin’s 3rd was competitive (just 1 lap off), improving his average from Seg. #1, but his 6.898s median indicated lingering grip problems in turns. Both earned 11/7 points here, keeping totals close (Dean at 23, Kevin at 24 overall). Segment times: ~180-185s, showing tighter pacing, though lower placers’ times aligned closely with leaders.
- Segment #3 (Green/Orange/White/Blue Lanes): Dean won (25 laps in Orange), Joe 2nd. Focus on lower: Steve Stewart’s 3rd (23 laps, 7.479s average in White) and Kevin Webster’s 4th (23 laps, 7.677s average in Blue). Tied in laps but separated by points (11 vs. 7), this segment exposed Bus Stop vulnerabilities—Steve’s 5.840s median was strong, but 2 laps short suggests incidents or power management in modified MegaG+ cars. Kevin’s 6.934s median and 6.135s fastest showed progress, yet his average remained high, pointing to Blue lane challenges or tire wear. Joe’s lead grew, but lower placers stayed within 2 laps, accumulating points (Steve to 31, Kevin to 31). Segment times: ~169-176s, with Kevin’s 175.840s reflecting sustained but slower effort.
- Segment #4 (Blue/Orange/Green/White Lanes) / Final: Steve won the segment (25 laps in Green), Dean 2nd. Emphasizing lower: Joe Clarke’s 3rd (24 laps, 7.208s average in Orange) and Kevin Webster’s 4th (21 laps, 7.935s average in White). Joe’s 3rd—despite tying Dean’s total laps overall—stemmed from a 6.234s median but 1 lap shy, possibly fatigue or minor errors in the chicane. Kevin’s weakest segment (4 laps behind, highest 7.935s average) capped his race, with a 6.958s median suggesting White lane disadvantages or setup fatigue in the modified class. His 7 points here finalized 4th overall, but the 21 laps highlighted the Bus Stop’s toll on consistency. Segment times: ~165-176s, with lower placers’ longer runs (175s+) indicating endurance over speed.
Key Insights on Lower Placings: Kevin Webster’s consistent 4th overall reflected the MegaG+ 1.7 Modified class’s demands on the Bus Stop layout—strong starts (2nd in Seg. #1) faded to deficits (21 laps in finale), with averages ~0.5-1s slower than leaders due to medians in the 6.9s range, likely from grip or gearing issues in tight turns. Flashes like his 6.135s fastest suggest potential; tweaks could push him higher. Steve Stewart’s early 4th and mid-race 3rd showed recovery but cost points (47 total), emphasizing lane rotation impacts. Joe’s brief 3rd in the final prevented a win despite a lap tie, underscoring segment volatility. Lower drivers demonstrated resilience, with the Bus Stop equalizing the field in modified cars—future events may favor those mastering chicane setups. Details
Race 3: PR-5 GT F1 Hardbody (i)
Final Standings Table (Aggregated from All Segments):
|
Place
|
Name
|
Total Laps
|
Total Points
|
Total Run Time (s)
|
Avg Lap Time (s)
|
Fastest Lap (s)
|
Median Lap Time (s)
|
|---|---|---|---|---|---|---|---|
|
1
|
Dustin Jolley
|
120
|
58
|
608.263
|
5.069
|
4.044
|
~4.8
|
|
2
|
Steve Stewart
|
117
|
56
|
610.393
|
5.217
|
4.055
|
~4.9
|
|
3
|
Dean Donaldson
|
110
|
47
|
620.527
|
5.641
|
~5.0
|
~5.2
|
|
4
|
Joe Clarke
|
114
|
42
|
658.058
|
5.772
|
4.092
|
~5.4
|
|
5
|
Kevin Webster
|
93
|
32
|
628.190
|
6.754
|
~6.0
|
~6.5
|
Notes on Aggregates: Average lap times calculated as total run time divided by total laps (lower is better). The faster paces (4-6s/lap) compared to Races 1-2 reflect SR2’s layout, potentially with less elevation or smoother surfaces, though the Bus Stop still penalized inconsistencies.
Segment-by-Segment Breakdown (Summarized from available data; full per-lane metrics limited):
-
- Segment #1 (Joe Clarke out): Dustin Jolley dominated on Yellow with 30 laps (16 points, 4.595s average). Steve Stewart 2nd. Focusing on lower: Dean Donaldson and Kevin Webster trailed with fewer laps (exact counts not specified, but behind the top two), likely struggling with initial Bus Stop adaptation in their lanes. Kevin’s higher overall average suggests this segment highlighted his setup issues, possibly tire grip or gearing for the chicane, resulting in slower medians and a lap deficit that set a tough tone for his race.
- Segment #2 (Dustin Jolley out): Steve Stewart won on Yellow (30 laps, 16 points). Dean 2nd (lap count not specified, but strong). Emphasizing lower: Kevin Webster and Joe Clarke both completed 27 laps (3rd and 4th), earning 11 and 7 points respectively. Joe’s sit-out in Seg. #1 meant he started from behind, and his 27 laps here showed a solid rebound but highlighted pacing issues on the Bus Stop, with averages potentially inflated by turns. Kevin’s consistent but mid-pack finish indicated ongoing challenges, perhaps lane-specific (e.g., Blue or White disadvantages), contributing to his lower efficiency.
- Segment #3 (Steve Stewart out): Dean Donaldson won on Yellow (30 laps, 16 points). Dustin 2nd on Red. Focus on lower: Joe Clarke 3rd (lap count not specified, 11 points); Kevin Webster 4th with 18 laps in Blue (7 points). Kevin’s low lap count—12 behind the winner—was his weakest, possibly from off-tracks or mechanical hiccups in the Bus Stop’s tight sections, inflating his average to near 9s in some reports. Joe’s 3rd was respectable but reflected variability, as his fastest lap (4.092s) showed potential not fully realized due to consistency lapses.
- Segment #4 (Dean Donaldson out): Dustin Jolley won on White (30 laps, 16 points). Joe 2nd with 29 laps (13 points). Emphasizing lower: Steve 3rd and Kevin Webster 4th with fewer completions (exact laps not specified, 11 and 7 points). Kevin’s continued lower placement underscored the Bus Stop’s demands on endurance, with his slower averages (up to 9.088s in similar segments) pointing to adaptation struggles or car tuning needs. Joe’s strong 2nd here boosted his total but couldn’t overcome earlier gaps, suggesting fatigue or lane rotation impacts.
- Segment #5 (Kevin Webster out): Steve Stewart won on White (30 laps, 16 points). Dustin 2nd. Focus on lower: Joe Clarke 3rd with 28 laps (11 points); Dean Donaldson 4th with 23 laps (7 points). Dean’s slip to 4th—his lowest—was notable for the points leader in prior races, with only 23 laps indicating possible incidents or setup mismatch in the Bus Stop chicane during his lane. Joe’s 3rd was consistent but not enough for podium, while Kevin’s sit-out allowed recovery time but left him with the event’s lowest laps, emphasizing his overall challenges.
Key Insights on Lower Placings: Dean Donaldson’s 3rd overall (110 laps, 47 points) was a step back from his Race 2 win, with his 5.641s average reflecting inconsistency on the Bus Stop—strong in Seg. #3 (win) but weak in #5 (23 laps), possibly from lane disadvantages or minor errors in turns. His points efficiency (0.427 pts/lap) was solid, but fewer laps than expected suggest room for better reliability in multi-segment formats. Joe Clarke’s 4th (114 laps, 42 points) showed resilience, with a competitive 4.092s fastest lap, but higher average (5.772s) and variable placements (3rd/4th in most) indicate Bus Stop pacing issues, perhaps over-driving the chicane leading to time losses. His longer total time (658s) despite more laps than Dean points to endurance strengths but efficiency opportunities. Kevin Webster’s 5th (93 laps, 32 points) epitomized the lower field struggles, with the highest average (6.754s) and lowest laps due to poor segments like #3 (18 laps), likely from setup mismatches or learning the new Bus Stop layout. Flashes of competitiveness (e.g., 27 laps in #2) hint at potential, but his 0.344 pts/lap efficiency underscores needs for tweaks in grip or strategy to climb in future SR2 events.
Race 4: Viper V-SPEC SPEC STOCK Lexan
Final Standings Table (Aggregated from All Segments):
|
Place
|
Name
|
Total Laps
|
Total Points
|
Total Run Time (s)
|
Avg Lap Time (s)
|
Fastest Lap (s)
|
Median Lap Time (s)
|
|---|---|---|---|---|---|---|---|
|
1
|
Joe Clarke
|
119
|
56
|
533.648
|
4.484
|
3.195
|
3.542
|
|
2
|
Steve Stewart
|
119
|
50
|
548.073
|
4.606
|
3.172
|
3.655
|
|
3
|
Dustin Jolley
|
117
|
56
|
541.774
|
4.630
|
3.226
|
3.597
|
|
4
|
Dean Donaldson
|
109
|
45
|
551.810
|
5.062
|
3.296
|
3.964
|
|
5
|
Kevin Webster
|
94
|
28
|
524.270
|
5.577
|
3.540
|
4.566
|
Notes on Aggregates: Average lap times from total run time divided by total laps (lower is faster). Fastest laps are the minimum across segments; medians are averages of reported segment medians. The straight course enabled sub-4s laps, but lower drivers’ higher averages (5s+) indicate setup or consistency issues, with sit-outs adding variability.
Segment-by-Segment Breakdown:
-
- Segment #1 (Steve Stewart out; Blue/Yellow/White/Red Lanes): Joe Clarke won from Blue (30 laps, 4.084s average). Dustin Jolley 2nd. Emphasizing lower: Dean Donaldson’s 3rd (28 laps, 4.462s average in White) and Kevin Webster’s 4th (21 laps, 5.765s average in Red). Dean trailed by 2 laps with a solid 3.750s median but higher average, suggesting early throttle control issues on straights. Kevin’s 9-lap deficit and 4.759s median highlighted his weakest start, possibly from Red lane disadvantages or stock setup mismatches, inflating time despite a competitive 4.391s fastest. Both earned 11/7 points, but sit-out for Steve kept totals low initially. Segment times: ~127-129s.
- Segment #2 (Dustin Jolley out; Yellow/Blue/White/Red Lanes): Joe again won (30 laps in Yellow). Steve 2nd on debut. Focus on lower: Dean Donaldson’s 3rd (27 laps, 4.733s average in Blue) and Kevin Webster’s 4th (21 laps, 5.955s average in White). Dean’s 3 laps short of the winner showed improvement but consistency lapses (3.580s median), perhaps from over-pushing on straights. Kevin repeated his low output (21 laps), with a 5.111s median indicating grip or power delivery problems, though his 3.868s fastest rivaled leaders—hinting at potential stifled by errors. Dustin’s sit-out leveled the field temporarily, but lower placers’ 11/7 points kept them trailing (Dean at 22, Kevin at 14). Segment times: ~128-132s.
- Segment #3 (Joe Clarke out; Yellow/Blue/White/Red Lanes): Dean Donaldson won his only segment (30 laps, 4.460s average in Yellow). Steve 2nd. Emphasizing lower: Dustin Jolley’s 3rd (28 laps, 4.804s average in Red) and Kevin Webster’s 4th (28 laps, 4.823s average in Blue). Dustin’s slip—despite a 3.843s median—came 2 laps short, possibly from Red lane challenges or minor incidents, costing momentum with 11 points. Kevin’s best relative finish (tied laps with Dustin) marked progress, tightening his average and 4.137s median, suggesting adaptation to the straight course’s speed—though still 7 points here, his total reached 21. Joe’s sit-out allowed lower drivers to close gaps temporarily. Segment times: ~138-142s.
- Segment #4 (Dean Donaldson out; Yellow/Red/Blue/White Lanes): Dustin Jolley won (30 laps in White). Steve 2nd. Focus on lower: Joe Clarke’s 3rd (29 laps, 4.222s average in Red) and Kevin Webster’s 4th (24 laps, 5.111s average in Yellow). Joe’s near-miss (1 lap off) with a 3.700s median was solid but uncharacteristic for the leader, perhaps Red lane or fatigue-related, earning 11 points to maintain his edge. Kevin’s 6-lap deficit reverted to early form, with a 4.258s median inflated by possible off-tracks on straights, adding just 7 points (total 28). Dean’s sit-out preserved his laps but halted his surge. Segment times: ~124-127s.
- Segment #5 (Kevin Webster out; White/Yellow/Blue/Red Lanes) / Final: Dustin won the segment (30 laps in Blue). Joe 2nd. Emphasizing lower: Steve Stewart’s 3rd (30 laps, 4.873s average in Yellow) and Dean Donaldson’s 4th (24 laps, 6.048s average in Red). Steve’s 3rd—completing full laps but with an elevated 3.810s median—secured 11 points, but couldn’t overtake Joe’s total despite lap tie. Dean’s weakest (6 laps short, highest 6.048s average) capped his race, with a 4.803s median suggesting Red lane struggles or setup fatigue, yielding 7 points (total 45). Kevin’s sit-out finalized his low laps, underscoring endurance limits.
Key Insights on Lower Placings:
Series Standings 2026 “Under The Lights”
| Place | Name | Laps | Points | Total Time |
| Junior Division | ||||
| 1 | Austin Brentmar | 204 | 100 | 2060.362 |
| 2 | Rye Jolley | 187 | 68 | 2147.751 |
| Sportsman Division | ||||
| 4 | Joe Clarke | 1324 | 572 | 9902.457 |
| 5 | Jeff Seltzer | 337 | 160 | 3206.600 |
| 6 | Wayne Locke | 341 | 136 | 2019.909 |
| 8 | Bev Seltzer | 310 | 129 | 3090.575 |
| 10 | Mike Langell | 262 | 98 | 3506.202 |
| 11 | Ramsey Wright | 202 | 85 | 2005.230 |
| 13 | Max Dunn | 103 | 49 | 999.582 |
| 14 | Tara DelaGarza | 89 | 38 | 1002.428 |
| 15 | Mark Wialbut | 98 | 35 | 1058.522 |
| 17 | Phil Rogers | 71 | 28 | 710.348 |
| Expert Division | ||||
| 1 | Steve Stewart | 2171 | 1202 | 17086.699 |
| 2 | Dean Donaldson | 2070 | 1037 | 17340.921 |
| 3 | Dustin Jolley | 1966 | 1000 | 15711.202 |
| 7 | Kevin Webster | 367 | 134 | 2576.835 |
Team Clarke’s, Joe Clarke, leads the Sportsman division points and is likely our next Expert division addition. After four “Under The Lights” events, Joe is well ahead of his nearest rival, Seltzer Racing’s Jeff Seltzer. With one more event to complete, Joe is quite likely to get the nod to the Expert ranks very soon.
There were a few new lap records on SR2 on Wednesday night. Stay tuned, but Joe Clarke appears to have one of them.