Not one, but two new drivers in the field for this one. Dean Donaldson (Full-Speed Racing) continues to dominate the competition for 2026 Promoter of the Year. Introducing “Wild Bill” Whiteside and “Tracker Clay.”
-
-
- Bill is a local racer from the Stetson Road area and, obviously, a very talented one.
- Tracker Clay is actually a code name for Eric Newton, who lives in Campbell, and a good friend was invited to race with us by another great local driver, Max Dunn.
-
Mostly AI-generated from here.
Overall Results:
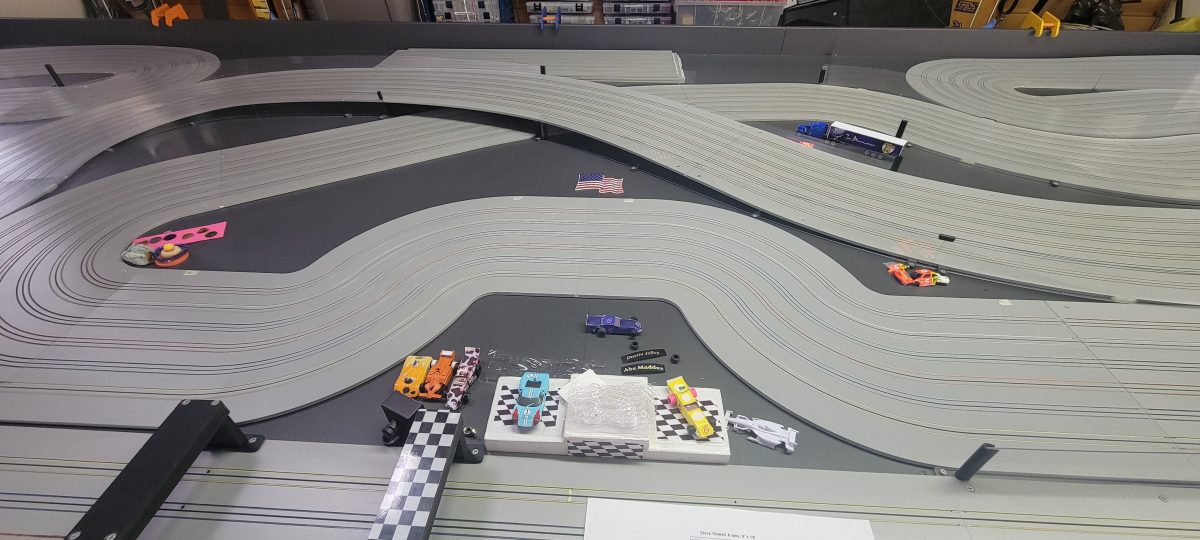
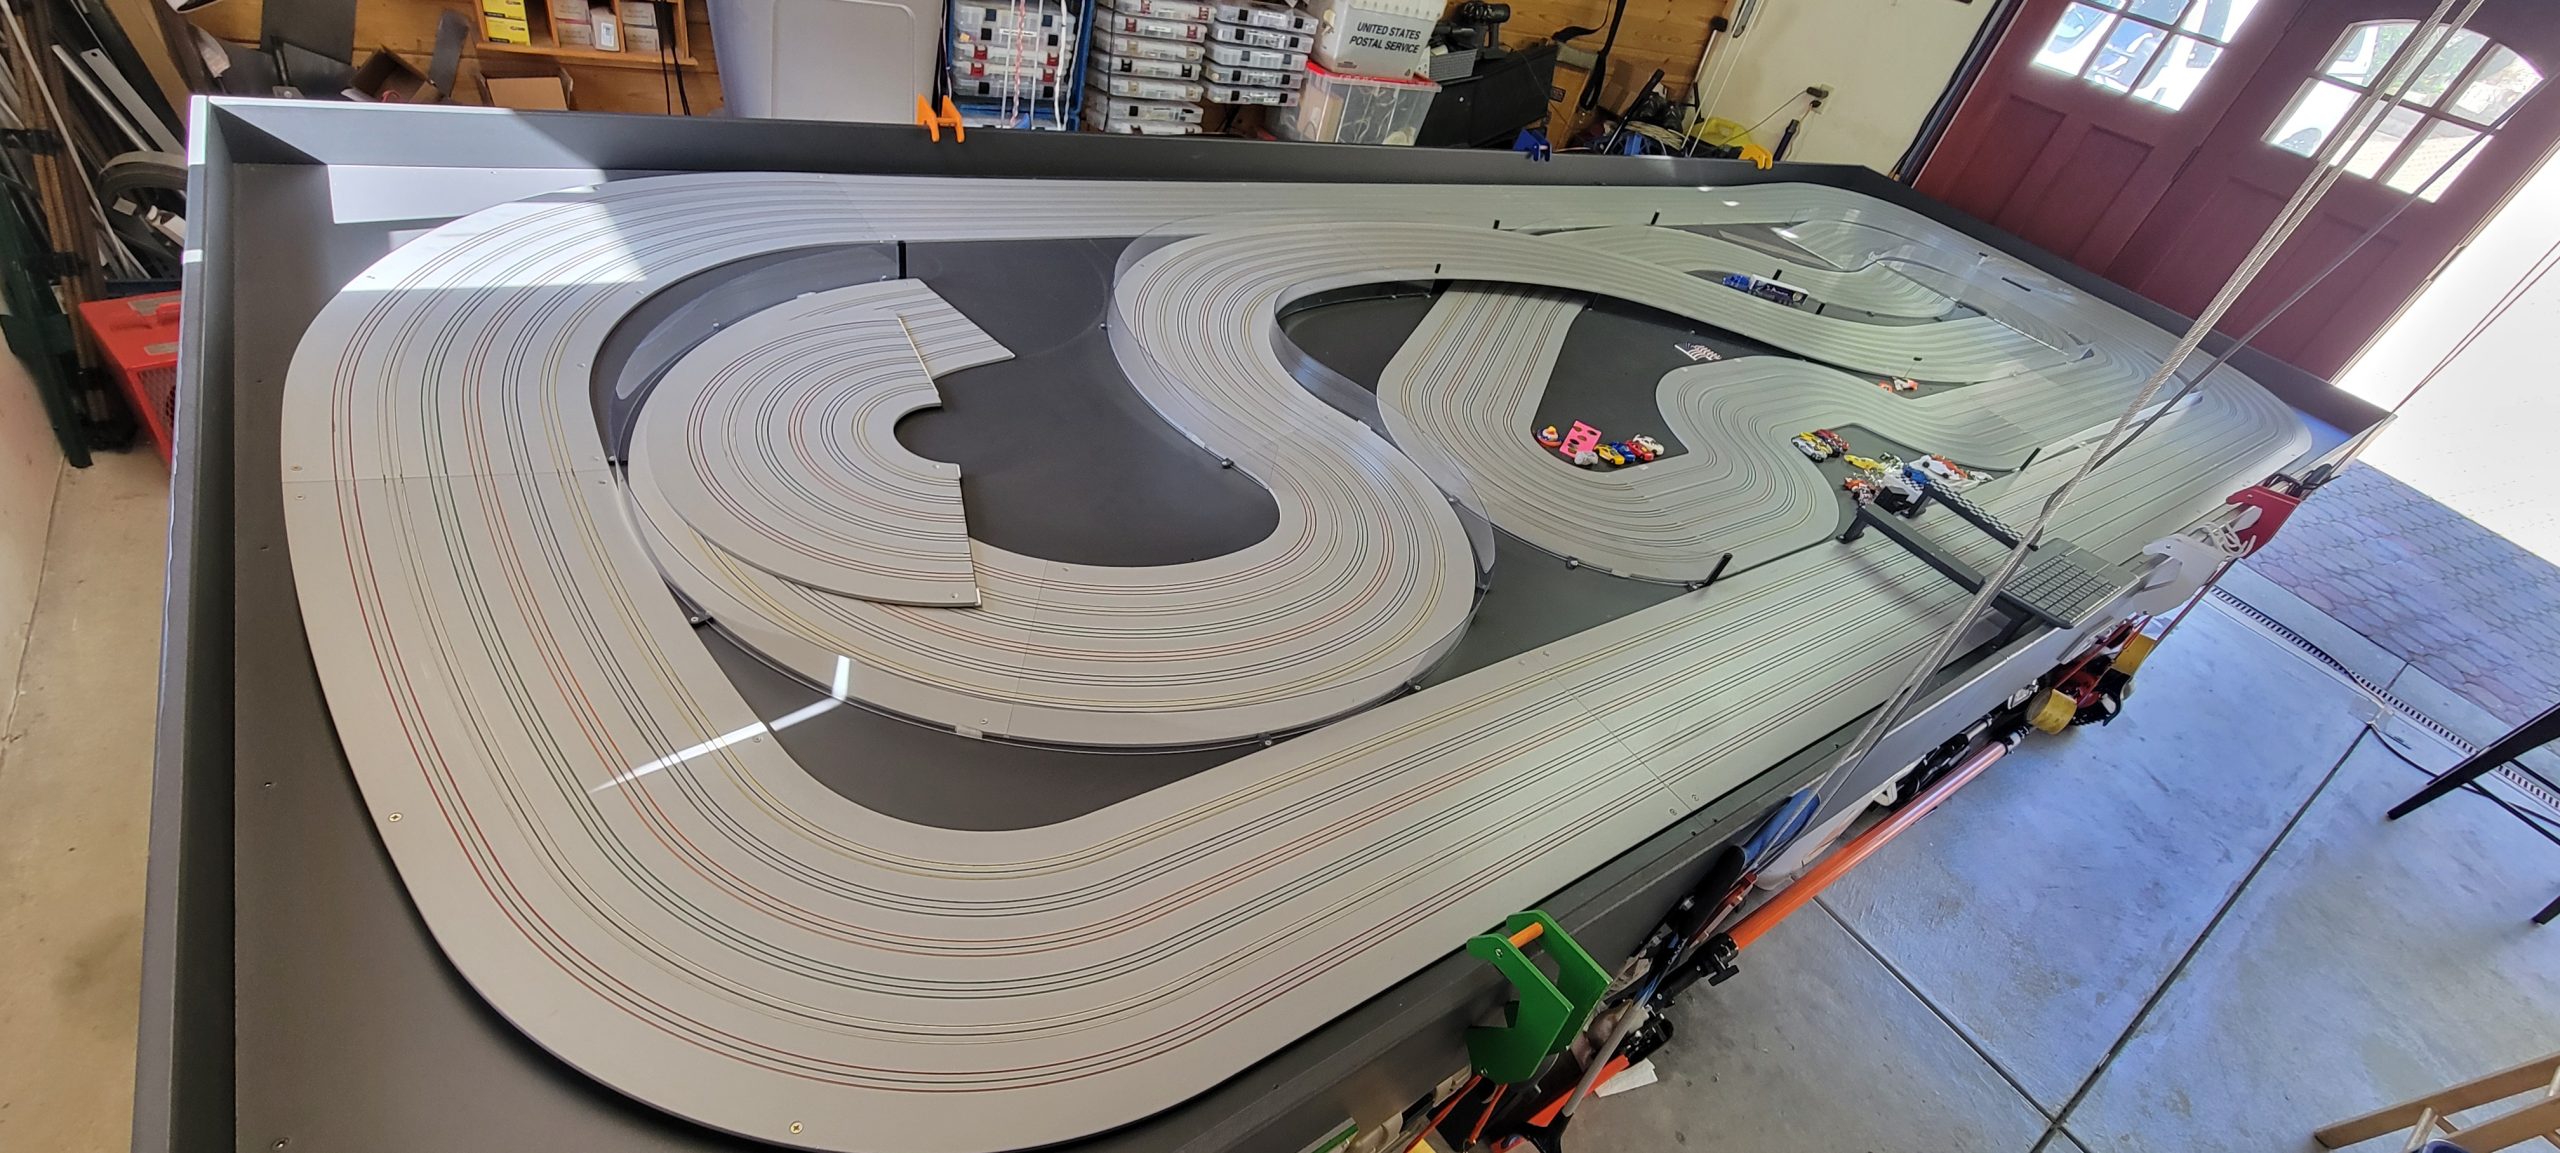
Wednesday Night Under The Lights Event (Three Races on SR3 Squeeze Lane Road Course) The Stewart Raceway Wednesday Night Under The Lights event consisted of three races on the SR3 track using the Squeeze Lane road course layout. Steve Stewart dominated with 370 laps and 216 points, but the field was competitive among the top four, separated by just 26 laps.
|
Place
|
Name
|
Laps
|
Points
|
Total Time (sec)
|
|---|---|---|---|---|
|
1
|
Steve Stewart
|
370
|
216
|
3411.162
|
|
2
|
Dustin Jolley
|
358
|
172
|
3524.342
|
|
3
|
Bill Whiteside
|
347
|
150
|
3564.999
|
|
4
|
Dean Donaldson
|
344
|
164
|
3517.826
|
|
5
|
Ramsey Wright
|
301
|
104
|
3537.086
|
|
6
|
Max Dunn
|
132
|
40
|
1348.612
|
|
7
|
Tracker Clay
|
97
|
30
|
1368.364
|
Three-Race Analysis
Key metrics calculated from the data:
-
- Average Lap Time (seconds/lap): Total time ÷ laps (lower = faster).
- Steve Stewart: 9.219 (strongest pace overall)
- Dustin Jolley: 9.845
- Dean Donaldson: 10.226
- Bill Whiteside: 10.274
- Ramsey Wright: 11.752
- Max Dunn: 10.216
- Tracker Clay: 14.107 (highest, indicating significant adaptation challenges)
- Points Efficiency (points/lap): Points ÷ laps (higher = better scoring relative to distance).
- Steve Stewart: 0.584 (highest – dominant consistency)
- Dean Donaldson: 0.477
- Dustin Jolley: 0.480
- Bill Whiteside: 0.432
- Ramsey Wright: 0.345
- Max Dunn: 0.303
- Tracker Clay: 0.309
- Average Lap Time (seconds/lap): Total time ÷ laps (lower = faster).
Top-three battle: Steve, Dustin, and Bill were separated by only 23 laps total, with Steve’s superior average lap time and points haul securing the win. Dean Donaldson’s 4th-place finish is notable—he scored more points than Bill despite fewer laps, suggesting stronger individual race wins or segment bonuses on the Squeeze Lane, where clean runs through the narrow section paid big dividends.
-
- Ramsey Wright (5th, 301 laps, 104 points, 3537.086 s): Solid mid-pack endurance but the slowest average pace among full participants (11.752 s/lap). His points efficiency was the lowest of the top five, indicating he was rarely contending for top segment finishes. The Squeeze Lane likely exposed setup or driving-line issues in the narrow section, costing him 1–2 seconds per lap compared with the leaders. With only 301 laps (roughly 20–25 laps per race behind the winner), small improvements in consistency could push him into podium contention next event.
- Max Dunn (6th, 132 laps, 40 points, 1348.612 s): Participated in approximately one-and-a-half races (roughly half the laps and time of the leaders). His 10.216 s/lap average was respectable and actually faster than several full-event runners, suggesting strong pace when on track but limited participation—possibly due to mechanical issues, scheduling, or testing. Points efficiency (0.303) was low, implying he didn’t convert speed into high finishes in the segments he ran. The Squeeze Lane’s demands may have contributed to early exits or conservative driving.
- Tracker Clay (7th, 97 laps, 30 points, 1368.364 s): Clearest example of the Squeeze Lane’s difficulty for newer or less-practiced drivers. Only ~97 laps across the three races (likely partial runs) with the event’s slowest average (14.107 s/lap) points to repeated time losses in the narrow squeeze zone. His low points total (30) and efficiency reflect minimal segment success. However, completing any laps on this layout shows commitment; targeted practice on the pinch point and minor car tweaks (gearing, tires, or body alignment) could yield rapid gains in future events.
Overall takeaways: Steve Stewart’s lap and points dominance confirmed his mastery of the Squeeze Lane layout. The event highlighted how the narrow section turned small setup differences into large lap gaps—especially for the lower placers. Dean Donaldson’s high points despite 4th in laps shows the scoring system rewards racecraft on technical sections. For the back half of the field, the Squeeze Lane proved unforgiving, but their respectable fastest-lap potential (visible in the pace of Max Dunn when running) indicates upside. Expect closer racing next time with refined setups tailored to the squeeze section.
Race 1 Analysis
Date: March 25, 2026
Class: Mega-G+ 1.7 Lites (Support Class)
Format: 7 × 25-lap segments (lane rotation + 1 driver sits out each segment)
Final Standings
|
Place
|
Name
|
Total Laps
|
Total Points
|
Total Run Time
|
Avg Lap Time
|
|---|---|---|---|---|---|
|
1
|
Steve Stewart
|
150
|
91
|
1,335.025 s
|
8.900 s
|
|
2
|
Dustin Jolley
|
147
|
80
|
1,351.608 s
|
9.195 s
|
|
3
|
Dean Donaldson
|
138
|
67
|
1,370.473 s
|
9.931 s
|
|
4
|
Bill Whiteside
|
138
|
54
|
1,372.458 s
|
9.945 s
|
|
5
|
Max Dunn
|
132
|
40
|
1,348.612 s
|
10.217 s
|
|
6
|
Ramsey Wright
|
125
|
44
|
1,365.594 s
|
10.925 s
|
|
7
|
Tracker Clay
|
97
|
30
|
1,368.364 s
|
14.107 s
|
Scoring note: In each segment, points are awarded 16 / 13 / 11 / 7 / 6 / 5 for 1st–6th place. Sitting out = 0 points.
Tiebreakers: Total laps first, then total points.
Key Takeaways
-
-
- Steve Stewart’s dominant comeback
He sat out Segment 1 (0 laps, 0 points) but still won the race by 3 laps over Dustin Jolley. Once he started racing in Segment 2, he was nearly perfect:- Ran full 25 laps in every one of his 6 segments (150 laps total).
- Won 5 of 6 segments he ran (16 points each) + 1 third-place finish (11 points) = 91 total points.
- Fastest overall pace by a wide margin (8.900 s/lap).
- Dustin Jolley led early (won Segments 1 & 3) and stayed in the hunt with 147 laps, but lost ground with a couple of lower-lap segments (23 in Seg 4, 24 in Seg 6). Still an excellent 2nd-place effort.
- Dean Donaldson vs. Bill Whiteside
Both finished with 138 laps, but Dean’s higher segment points (67 vs. 54) gave him the clear 3rd-place tiebreaker. - Pace comparison (overall average lap time)
Steve Stewart was in a class by himself. The top four drivers were all under ~10 seconds per lap, while the field dropped off noticeably after that. - Segment winners
- Seg 1: Dustin Jolley
- Seg 2: Steve Stewart
- Seg 3: Dustin Jolley
- Seg 4: Steve Stewart
- Seg 5: Steve Stewart
- Seg 6: Steve Stewart
- Seg 7: Steve Stewart
- Steve Stewart’s dominant comeback
-
Steve essentially took control of the race the moment he entered and never relinquished it. This was a classic “miss a segment but still win” performance thanks to flawless full-segment runs and consistently strong lap times once he was on track. The Mega-G+ 1.7 Lites look quick on the SR3 Squeeze Lane — several sub-6-second fastest laps were turned across the night.
Race 2 Analysis
Date: March 25, 2026
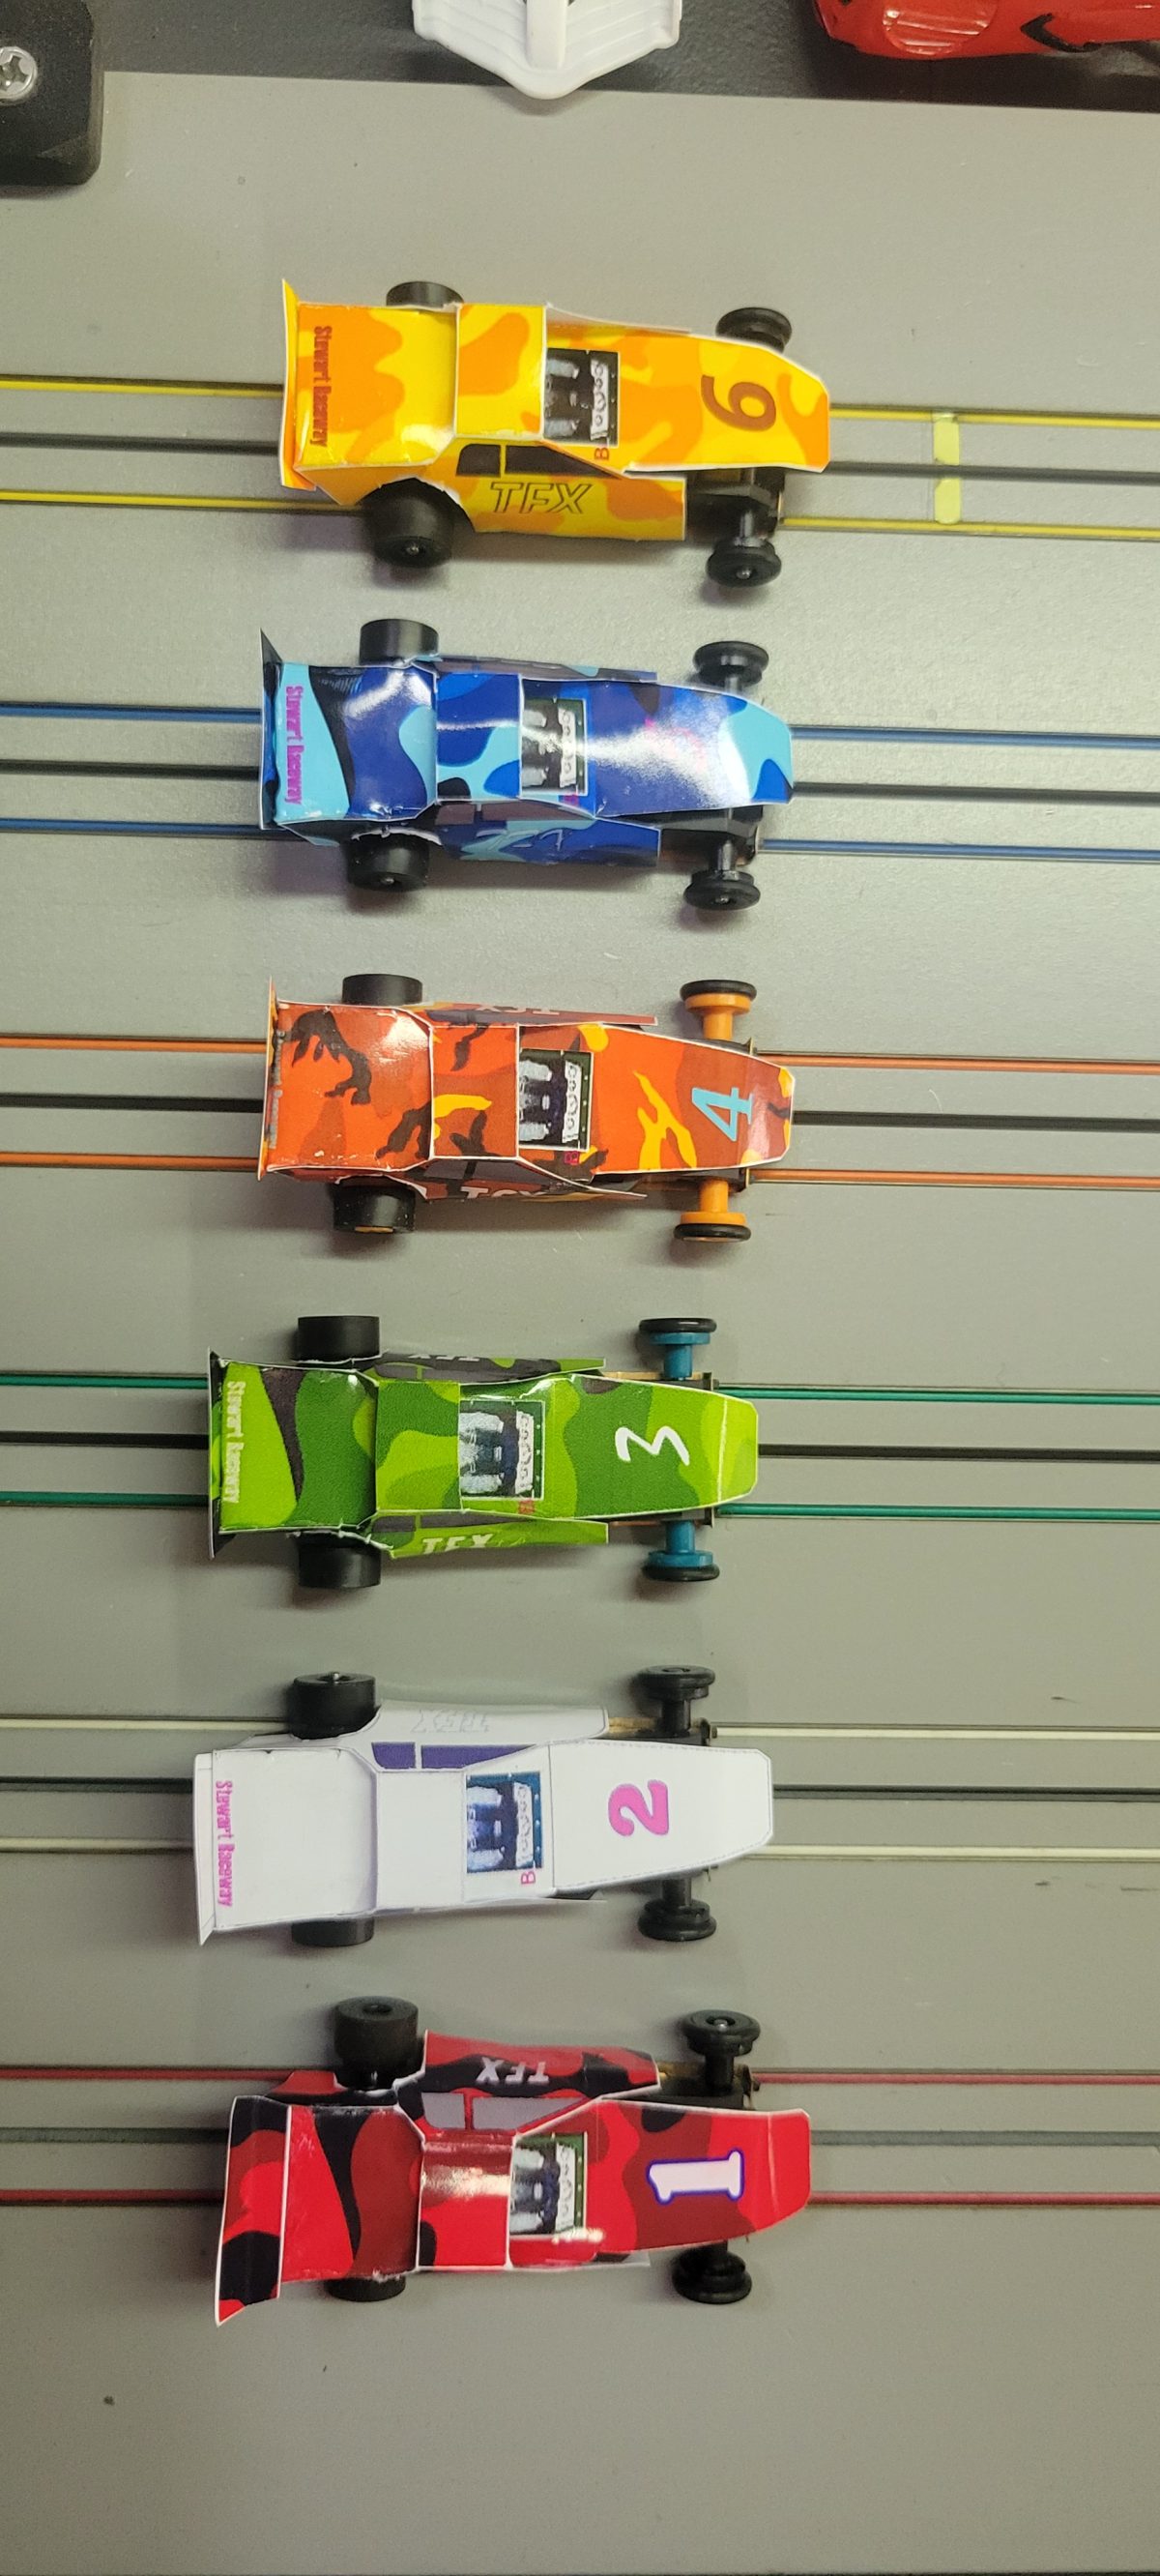
Class: OS3 TFX Super Lite (i)
Format: 5 × 25-lap segments (lane rotation + 1 driver sits out each segment)Final Standings
|
Place
|
Name
|
Total Laps
|
Total Points
|
Total Run Time
|
Avg Lap Time
|
|---|---|---|---|---|---|
|
1
|
Steve Stewart
|
100
|
64
|
1,282.398 s
|
12.824 s
|
|
2
|
Dustin Jolley
|
94
|
47
|
1,364.788 s
|
14.519 s
|
|
3
|
Bill Whiteside
|
93
|
48
|
1,342.930 s
|
14.440 s
|
|
4
|
Dean Donaldson
|
90
|
44
|
1,332.660 s
|
14.807 s
|
|
5
|
Ramsey Wright
|
81
|
32
|
1,376.179 s
|
16.989 s
|
Scoring note: 16 / 13 / 11 / 7 points for 1st–4th in each segment (5 drivers = 1 sits out each time). Tiebreakers: total laps first, then total points.
Key Takeaways
-
-
- Steve Stewart’s repeat masterclass
Sat out Segment 1 (0 laps, 0 points) but still cruised to victory. Once he entered the race:- Ran perfect 25 laps in all 4 segments he drove = 100 laps total.
- Won every single segment he ran (16 points × 4 = 64 total points).
- Blisteringly fast pace for this class (12.824 s/lap overall — over 1.5 seconds quicker per lap than anyone else).
- Dustin Jolley again led early (won Segment 1) and stayed competitive, but the missed Segment 3 + a couple of 22-lap segments cost him. Still a solid 2nd.
- Bill Whiteside edged Dustin in total points (48 vs 47) but finished 3rd because he completed 1 fewer lap.
- Pace comparison (overall average lap time)
Steve was in a league of his own. The rest of the field was tightly bunched in the mid-14-second range, with Ramsey Wright struggling to stay under 17 seconds. - Segment winners
- Seg 1: Dustin Jolley
- Seg 2: Steve Stewart
- Seg 3: Steve Stewart
- Seg 4: Steve Stewart
- Seg 5: Steve Stewart
- Steve Stewart’s repeat masterclass
-
This was another “sit out the first heat and still dominate” performance from Steve — identical script to Race 1, just on a shorter 5-segment schedule and with slower TFX Super Lite cars. The OS3 class clearly runs about 4–5 seconds per lap slower than the Mega-G+ 1.7 Lites from earlier in the evening.
Race 3 Analysis
Track: SR3 Road Course Squeeze Lane
Date: March 25, 2026
Class: Viper V-SPEC SPEC STOCK Lexan
Format: 5 × 30-lap segments (lane rotation + 1 driver sits out each segment)Final Standings
|
Place
|
Name
|
Total Laps
|
Total Points
|
Total Run Time
|
Avg Lap Time
|
|---|---|---|---|---|---|
|
1
|
Steve Stewart
|
120
|
61
|
793.739 s
|
6.614 s
|
|
2
|
Dustin Jolley
|
117
|
45
|
807.946 s
|
6.906 s
|
|
3
|
Dean Donaldson
|
116
|
53
|
814.693 s
|
7.023 s
|
|
4
|
Bill Whiteside
|
116
|
48
|
849.611 s
|
7.324 s
|
|
5
|
Ramsey Wright
|
95
|
28
|
795.313 s
|
8.372 s
|
Scoring note: 16 / 13 / 11 / 7 points for 1st–4th in each segment (5 drivers = 1 sits out each time). Tiebreakers: total laps first, then total points.
-
-
- Steve Stewart’s hat-trick of dominant comebacks
Sat out Segment 1 again (0 laps, 0 points) but still won the race by 3 laps over Dustin Jolley. Once he joined:- Ran perfect 30 laps in all 4 segments he drove = 120 laps total.
- Won 3 of 4 segments (16 points each) + one 2nd-place finish (13 points) = 61 total points.
- Blistering overall pace (6.614 s/lap — over 0.29 seconds faster per lap than 2nd place).
- Dustin Jolley started strong (won Segment 1) and stayed in the fight with consistent 28–30 lap segments, but the missed Segment 3 and one lower finish kept him in 2nd.
- Dean Donaldson vs. Bill Whiteside
Both ended with 116 laps, but Dean’s higher segment points (53 vs. 48) secured 3rd place. - Pace comparison (overall average lap time)
This Viper V-SPEC SPEC STOCK Lexan class was dramatically faster than the earlier races (~6.6–7.3 s/lap for the leaders vs. ~9 s for Mega-G+ and ~13–15 s for OS3 TFX). Steve was again the clear pace-setter. - Segment winners
- Seg 1: Dustin Jolley
- Seg 2: Dean Donaldson
- Seg 3: Steve Stewart
- Seg 4: Steve Stewart
- Seg 5: Steve Stewart
- Steve Stewart’s hat-trick of dominant comebacks
-
Same script as Races 1 and 2 — Steve skips the first heat, then takes over and never looks back. The Viper class produced some seriously quick times (multiple sub-5-second fastest laps across the night).
Announcements:
-
- Dustin Jolley (Team Jolley) was upgraded to the Expert division a few weeks ago. Dustin topped the Sporstman points chase after five consecutive “Under The Lights” events. He’s currently in 3rd place in the Expert division.
- Joe Clarke (Clarke Racing) also advances to the Expert division after leading the Sportsman points chase after five consecutive “Under The Lights” events.
Dustin has a placing average of 2.1 and an average lap time of 7.423. Joe has an average placing of 3.4 and an average lap time of 7.525. Congrats!
We’re shooting for next Thursday night for another “Under The Lights” event and the beginning of a new five-event series. Stay tuned for confirmation and details.